Figure 6.
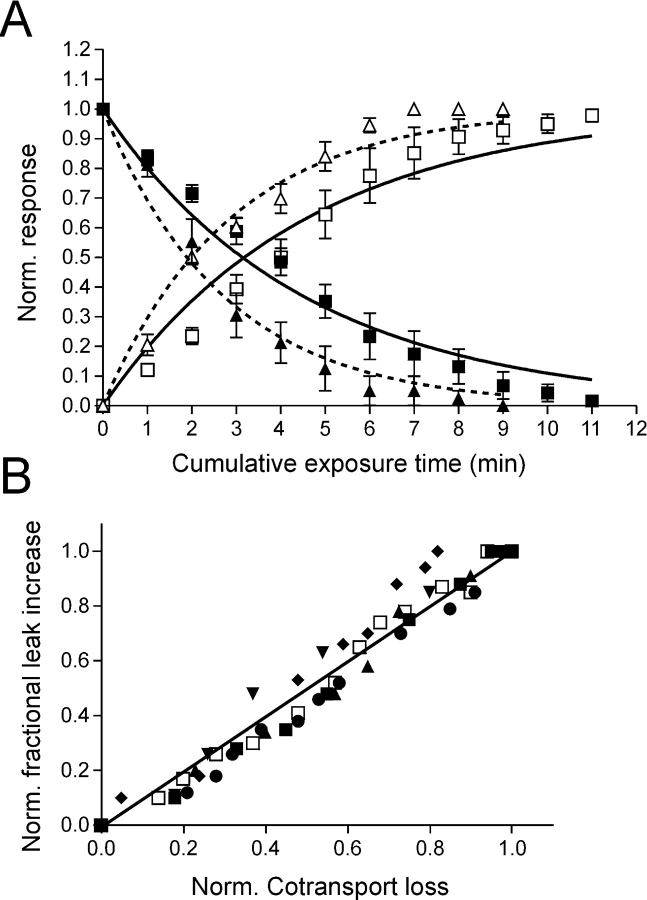
Quantification of cysteine modification reaction in terms of cotransport loss and leak gain. (A) Loss of cotransport function (filled symbols) and gain in leak (open symbols) for C-C mutant. Oocytes expressing the mutant were incubated for the indicated cumulative time with a fixed concentration (5 μM) of MTSEA (squares) or MTSES (triangles) and the electrogenic response to 1 mM Pi (cotransport mode) and 3 mM PFA (leak mode) was measured. The transport activity was normalized as explained in the text. Continuous (MTSEA) and dotted (MTSES) lines are fits to the data with a single exponential function of the form: exp(−[MTS] t k), for normalized cotransport loss, or: 1 − exp(−[MTS] t k), for normalized fractional leak gain, where [MTS] is the concentration of MTS reagent (in μM), t is the cumulated exposure time (s) and k is the effective second order rate constant (μM−1 s−1). Each data point represents mean ± SEM (n = 6). Points without error bars have SEMs smaller than symbol size. (B) Isochronic plot of normalized cotransport loss and fractional, normalized leak gain for the same cells as in A, for the MTSEA exposure. Each symbol represents a different oocyte.

