
Figure 2.

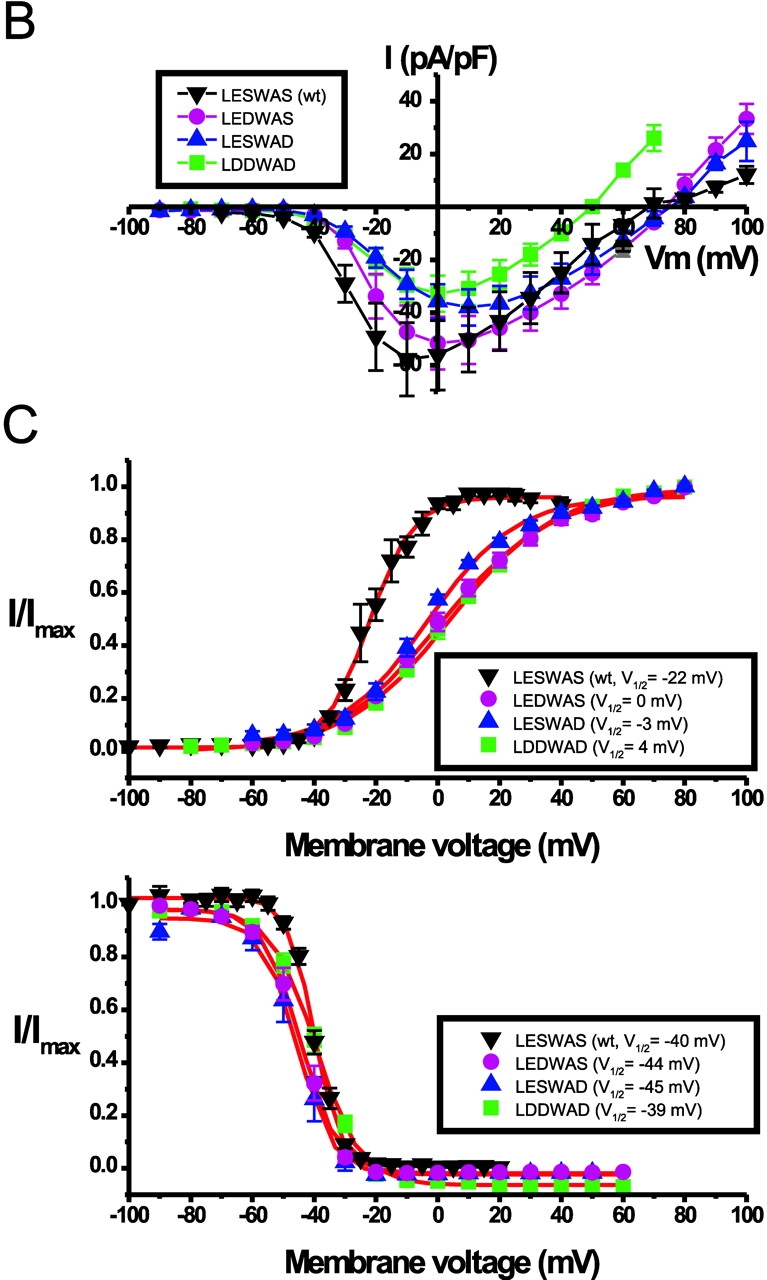
Voltage dependence of wt NaChBac and NaChBac mutants. (A) Representative currents recorded in 10 mM Ca2+/140 Na+ modified Tyrode's solution (left) from NaChBac and mutant NaChBac with residues 190–195 as indicated. Voltage was stepped from VH = −100 to 100 mV in 10-mV increments at 15-s intervals. (B) Averaged I-V curves derived from currents recorded as in (A) of NaChBac and mutant NaChBac (n = 8–12 cells each). (C) Activation (top; VH = −100 mV) and steady-state inactivation (bottom; VH = −100 mV, pulse test to peak for 2 s) curves of NaChBac and mutant NaChBac (n = 7–12 cells each).