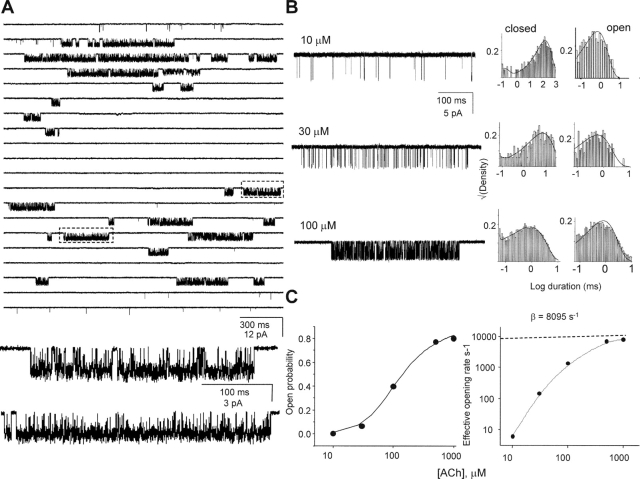
Figure 12.
Kinetic analysis of αF100V. (A) A continuous single-channel current trace of αF100V activated by 1 mM ACh. Boxed areas are shown below at higher resolution. (B) Current traces elicited at different concentrations of ACh and the corresponding interval duration histograms. The solid lines are from the global fit using Scheme I (k+ = 7.8 × 10⁷ M−1s−1 and k− = 16,845 s−1, corresponding to a KD of 215 μM). (C) Macroscopic dose–response analyses. Left, cluster Popen vs. [ACh]. Solid line is fit by Eq. 2 (L2 = 5.27 ± 0.9 and KD 189 ± 31 μM). Right, effective opening rate vs. [ACh]. The high-concentration limit is an estimate of β2 (8,095 s−1).

