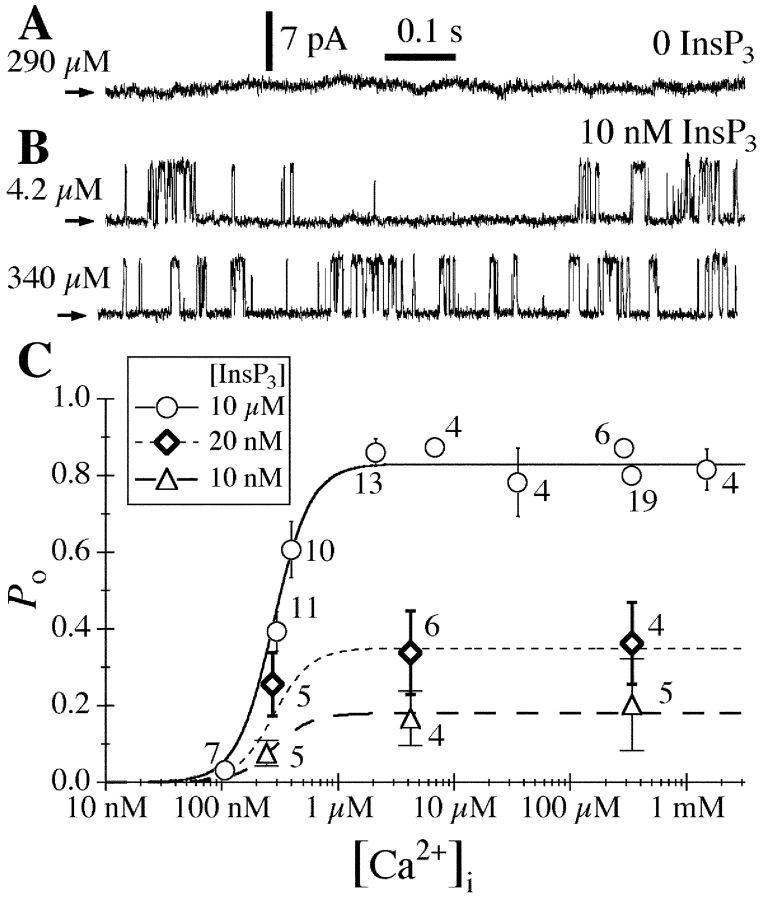
Figure 6.
(A and B) Typical current traces from nuclei isolated with protocol L. Arrows indicate closed channel current levels. (A) The pipette solutions contained no InsP3 and 290 μM [Ca2+]i as tabulated. (B) The pipette solutions contained 10 nM InsP3 and [Ca2+]i as tabulated. (C) [Ca2+]i dependence of the channel P o of the InsP3R in the presence of various [InsP3] as tabulated. The number of channels used to evaluate each of the data points (n) is tabulated next to the corresponding data point. Oocyte nuclei used were isolated using protocol L. The curves are simple activating Hill equation fits (Eq. 2) with the same K act = 280 nM and H act = 2.7. The dashed, dotted, and continuous curves have P max = 0.18, 0.35, and 0.84 for [InsP3] = 10 nM, 20 nM, and 10 μM, respectively.

