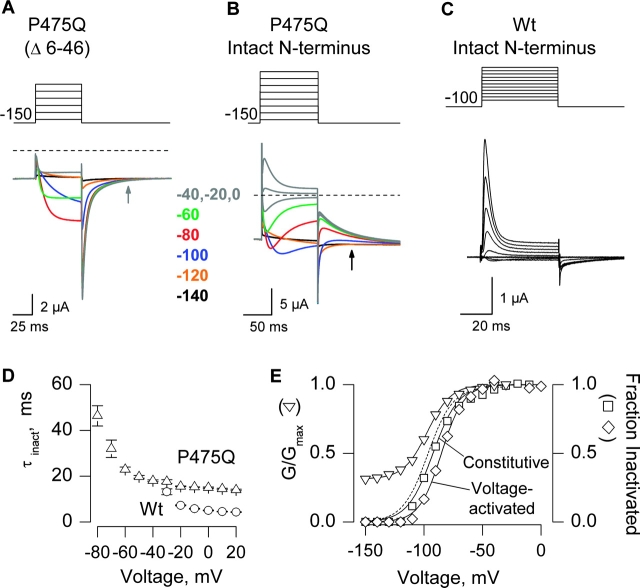
Figure 7.
N-type inactivation in the P475Q Shaker Kv channel. (A) Family of ionic currents for P475Q with deletion of residues 6–46. The cell was held at −100 mV, stepped to −150 mV for 200 ms before the traces shown, tail voltage was −150 mV, and depolarizations were between −140 and −40 mV in 20-mV steps. Linear capacity and background conductances were identified and subtracted by blocking the Shaker channel with Agitoxin-2. Horizontal dashed lines correspond to the zero current level. Charge carrier in the external solution was 50 mM Rb+. (B) Family of ionic currents for P475Q with an intact NH2-terminal inactivation ball. Same protocol and conditions as in A except that depolarizations were to between −140 and 0 mV in 20-mV steps. (C) Family of ionic currents for the wild-type Shaker channel with an intact NH2-terminal inactivation domain. Same conditions as in A except that depolarizations were from −80 to +20 mV (10-mV steps). (D) Kinetics of inactivation for wild-type and P475Q channels. Inactivation during the test pulses in B and C was fit with single exponential functions and the resulting time constants (τ) plotted against test voltage. n = 5 for both wild-type and P475Q. (E) Voltage dependence for activation and N-type inactivation. Open triangles, normalized tail current amplitude (measured in A) plotted against test voltage. Smooth black curve is a single Boltzmann fit to the G-V data with V50 = −97 mV, z = 2.5 with a fractional constitutive conductance of 0.31. Dashed black curve is a simulated G-V normalized to remove the constitutive conductance. Open squares, normalized fractional inactivation of the constitutive current at −150 mV plotted against voltage of the preceding test depolarization. Inactivation of constitutive current was measured at the black arrow in B, at which time deactivation in Δ6–46 (gray arrow in A) is nearly complete. Smooth curve is a single Boltzmann fit to the inactivation data with V50 = −92 mV, z = 2.3. Open diamonds, normalized fractional inactivation during the test depolarization (measured as the difference between the peak and steady-state currents in B) plotted against voltage of the test depolarization. Smooth black curve is a single Boltzmann fit to the inactivation data with V50 = −85 mV, z = 2.7.

