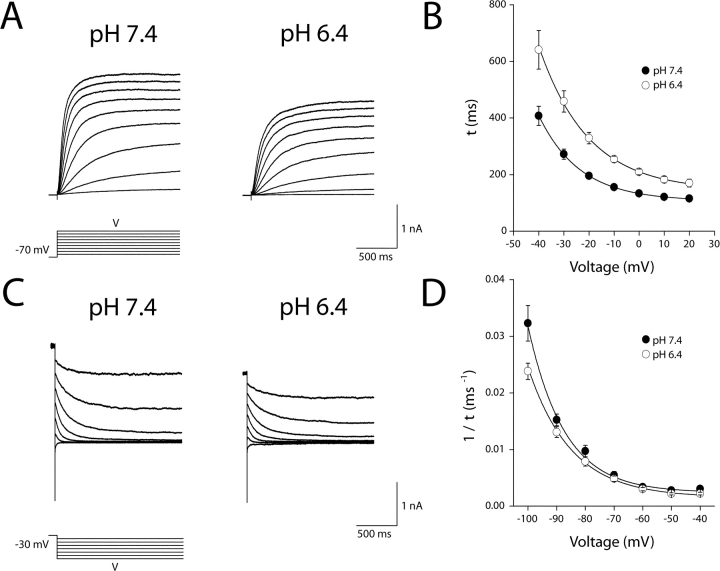
Figure 3.
Modulation of KCNQ2/3 current activation and deactivation kinetics by extracellular H+ ions. (A) Whole-cell KCNQ2/3 current activation relaxations in bathing solutions of different pH were evoked by depolarizing voltage pulses (1.5 s duration) from a holding potential of −70 mV. Currents shown are from the same cell. (B) Activation time constants (τ) for KCNQ2/3 current. Time constants were derived by fitting a single exponential to activation relaxations between the times 10 ms (to account for sigmoidal phase of activation) and 1500 ms after the onset of the depolarizing voltage pulse. The solid line shown is the fit of an exponential distribution to the time constants at different voltages. Parameters of this distribution were: A = 26.1 ms (pH 7.4) and 66.7 ms (pH 6.4); τ0 = 107.1 ms (pH 7.4) and 143.3 ms (pH 6.4); and x = e-fold/16.3 mV (pH 7.4), and e-fold/19.7 mV (pH 6.4). (C) Whole-cell KCNQ2/3 current deactivation relaxations in bathing solutions of different pH were evoked by hyperpolarizing voltage steps (1.5 s duration) after a depolarizing voltage pulse to −30 mV (1.5 s duration). Currents shown are from the same cell. (D) Reciprocal deactivation time constants (1/τ) for KCNQ2/3 current. Time constants were derived by fitting a single exponential to deactivation relaxations between the times 6 ms and 1,500 ms after the onset of the hyperpolarizing voltage pulse. Solid line is the fit of an exponential distribution to the time constants at different voltages. Parameters of this distribution were: A = 10−5 ms−1 (pH 7.4) and 3 × 10⁻⁵ ms−1 (pH 6.4); τ0 = 0.0024 ms−1 (pH 7.4) and 0.0015 ms−1 (pH 6.4); and x = e-fold/12.7 mV (pH 7.4) and e-fold/15.1 mV (pH 6.4).

