Figure 2.
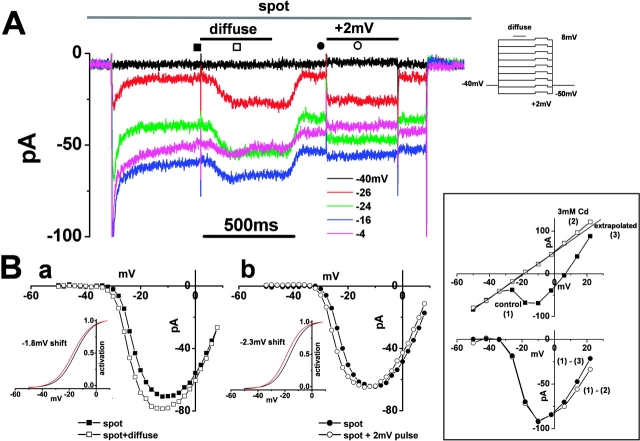
Surround illumination augments the cone Ca2+ current A. The Ca2+ current (ICa) in the cone photoreceptors of the newt retinal slice was recorded under the whole-cell voltage clamp condition. The retinal slice was superfused with control Ringer's solution buffered with bicarbonate and containing 100 μM picrotoxin. The cone was held at −40 mV and polarized to voltages ranging from −50 mV to +8 mV in 2-mV steps. Five representative traces, voltage- clamped at −40, −26, −24, −16, and −4 mV, are shown. During the command voltage, surround illumination (diameter, 4,000 μm; duration, 400 ms: shorter bar) was applied every 4 s, while the spot illumination (diameter, 30 μm: top bar) was maintained. An additional 2-mV depolarization was applied to mimic an ephaptic effect (external voltage drop) after withdrawing the surround illumination. Note that at −4 mV (pink trace); surround illumination evoked an inward current, while a +2-mV pulse evoked an outward current. The current amplitude was sampled at the time indicated by the symbols, to construct the I-V curves shown in B a and B b. (B a) Leak-subtracted I-V curve of the cone ICa in the presence of the spot (filled squares) and during surround illumination (open squares). The data are from the same cone as in A. The leakage current amplitude (conductance, 0.59 nS), determined by extrapolation of the linear portion of the I-V curve between −50 and −32 mV, was subtracted from the measured current amplitude at each voltage. Inset shows activation curves fitted to the Boltzmann function derived from the I-V curves. The midpoint of the curve as obtained under the control condition (−15.3 mV; black line) was shifted by 1.8 mV in the negative direction during surround illumination (red line). The maximum conductance was calculated from the slope of the I-V curve between +2 and +8 mV and normalized to 1.0. (b) Leak-subtracted I-V curve of the cone ICa in the presence of the spot light (filled circles) and during a +2-mV depolarizing pulse (open circles). Inset shows activation curves fitted to the Boltzmann function derived from the I-V curves. The midpoint of the curve as obtained under the control condition (−16.2 mV; black line) was shifted by 2.3 mV in the negative direction during the 2-mV induced depolarization (red line). The 0.3 mV discrepancy in the curve shifting is probably due to a curve fitting error or a voltage clamp error. (Boxed inset) Isolation method of I-V relations of cone ICa. These data were obtained from a different cone in A. (Top) The I-V relations of the cone were obtained in the control solution (filled squares (1)) and in a 3-mM Cd-containing solution (open squares (2)). The leakage conductance (2.7 nS) was estimated by extrapolating the linear part of the I-V curve between −50 and −36 mV (solid line (3)). (Bottom, open circles) I-V relations of the cone ICa obtained by subtracting the I-V curve recorded in a 3-mM Cd-containing solution from that recorded in the control solution ((1) − (2)). (filled circles) I-V relations obtained by subtracting the I-V curve from the extrapolated leakage current from that recorded in the control solution ((1) − (3)).

