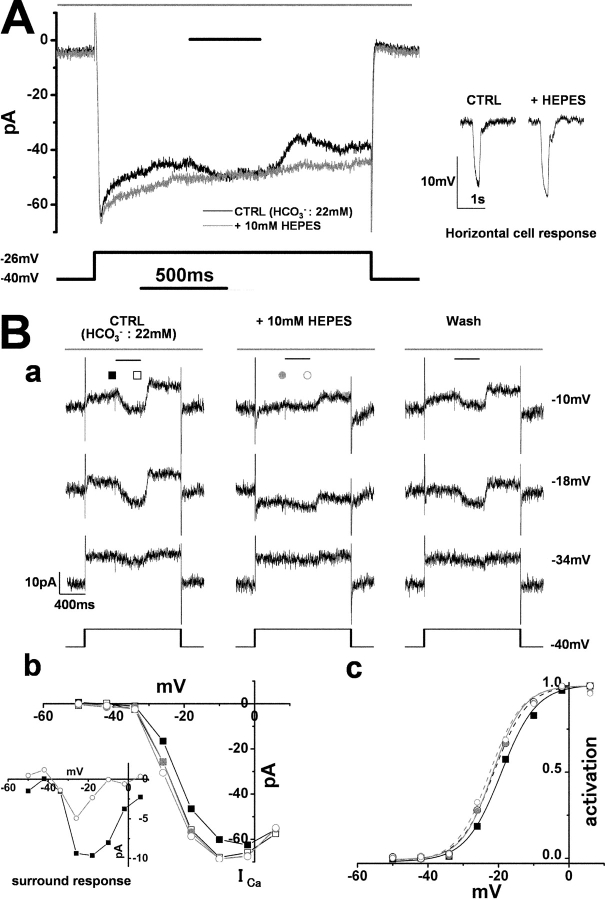
Figure 4.
The cone ICa and its surround response recorded in a superfusate enriched with HEPES. A cone photoreceptor in the retinal slice was recorded under whole-cell voltage clamp. The slice was superfused with control Ringer's solution (buffered with bicarbonate) and the solution enriched with HEPES to elevate the pH buffering capacity. (A) Effects of the 10-mM HEPES-enriched buffer on the cone ICa and surround response. The cone photoreceptor was depolarized from the holding voltage of −40 to −26 mV. Diffuse light (duration, 400 ms) illumination was given during the step depolarization (shorter bar) in the presence of a small spot light (diameter, 30 μm; top bar). (Black trace) Current recorded in the control solution (bicarbonate buffer alone). (Gray trace) Current recorded in the external solution with bicarbonate buffer plus 10 mM HEPES. The leakage conductance was 0.53 nS. Inset shows the horizontal cell responses to a large light spot (diameter, 4,000 μm; duration 100 ms), in the control solution and in the solution enriched with HEPES. (B a) Reversible effects of 10-mM HEPES-enriched buffer on the cone ICa and surround response. The small spot light (diameter, 30 μm) was kept on throughout (top bars). Diffuse light (duration, 400 ms) illumination was given during the step depolarization (shorter bar) in the presence of the small spot (diameter, 30 μm; top bar). The cone was held at −40 mV and polarized to voltages ranging from −50 to +6 mV in 8-mV steps. Representative traces, clamped at −34, −18, and −10 mV, are shown. (From the left through the middle to the right column) The current traces before (external HCO3 −: 22 mM), during, and after application of bicarbonate solution plus 10 mM HEPES. All the recordings were from the same cell. The recording sequence was left column (−34, −18, and −10 mV) followed by the middle column (the same command voltage sequence as that for the recording in the left column), and finally the right column. The leak conductance of 2.26 nS did not change either in the HEPES-containing solution or during the washout (see, for example the current traces at −34 mV). In the HEPES-containing solution, ICa in darkness was reversibly increased and the surround response was reversibly suppressed (see the current traces at −18 and −10 mV). Symbols denote the sampling points for calculation of the I-V curves of ICa (B b). In the control solution, the inward current produced by ICa was counterbalanced by the outward leak current (at −18 and −10 mV in the control and washout solutions). (b) I-V curves of the cone ICa recorded in B a. The leak conductance was subtracted. Filled squares, in the control solution without surround illumination; open squares, in the control solution during surround illumination; filled gray circles, in the HEPES-containing solution without surround illumination; open gray circles, in the HEPES-containing solution during surround illumination. Inset shows the voltage dependence of the surround response in the control solution (filled squares) and in the HEPES-containing solution (open circles). (c) Activation curves fitted to the Boltzmann function derived from the data in B b. The midpoint of activation curve shifted from −19.2 mV (control, black solid line) to −21.4 mV (surround illumination in control: black broken line), to −21.6 mV (no surround illumination in the HEPES-containing solution, gray solid line), and to −22.5 mV (surround illumination in the HEPES-containing solution, gray broken line). The maximum conductance was determined from the linear part of the curve, between −2 and 6 mV, obtained in the control solution during illumination with diffuse light, and normalized to 1.0.

