
Figure 8.
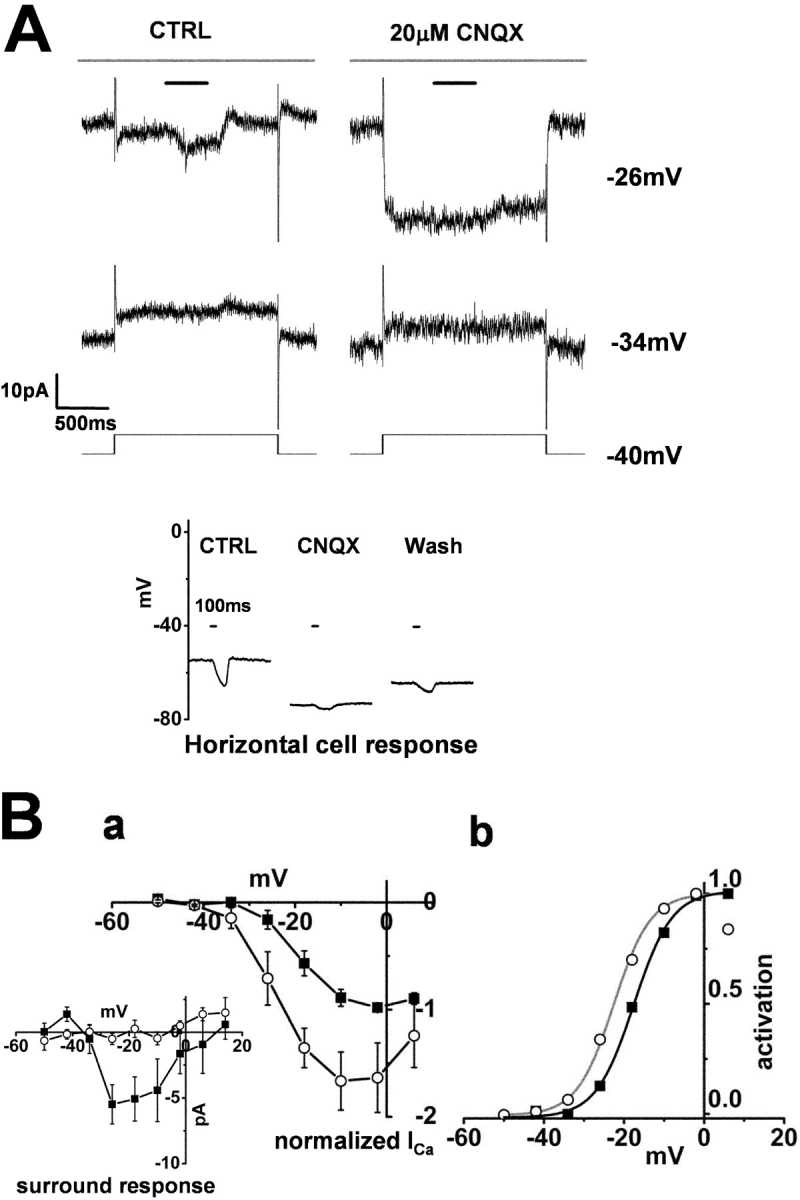
Effect of CNQX on the surround response of a cone photoreceptor and on a horizontal cell. Whole-cell recordings from a cone photoreceptor and a horizontal cell in a retinal slice superfused with control Ringer's solution (buffered with bicarbonate alone). (A) Effects of 20 μM CNQX on the ICa in a cone photoreceptor and its surround response. Diffuse light (duration, 400 ms) illumination was given during the step depolarization (shorter bar) in the presence of a small spot light (diameter, 30 μm; top bar). The cell was held at −34 and −26 mV from the initial holding voltage of −40 mV. The current traces shown in the left column were recorded in the control solution, and those shown in the right column were recorded in the solution containing 20 μM CNQX. All the recordings were from the same cell. The recording sequence was: left column (−34 mV, −18 mV), right column (the same command voltage sequence as that for the recording shown in the left column). The leak conductance was 1.6 nS. (Inset) Effect of CNQX on the light-evoked HC voltage response. The recording shown in the left column was obtained in control Ringer's solution, that in the middle column was obtained following the addition of 20 μM CNQX, and that in the right column was obtained after washout of the CNQX. A large (diameter, 4,000 μm; duration 100 ms) light spot was flashed, the timing of which is indicated by the short bar above each column. (B a) I-V curves of the ICa of 3 cones recorded under the same conditions as those described in A and averaged after normalization to each peak. Filled squares, current recorded in the control solution. Open circles, current recorded in the solution containing 20 μM CNQX. Error bars indicate the SEM. (Inset) Changes in the ICa induced by surround illumination recorded in the control solution (filled squares) and in the solution containing 20 μM CNQX (Open circles). Average from three cones. (b) Activation curves fitted to the Boltzmann function derived from B a. CNQX shifted the midpoint of the curve from −17.5 mV (black line) to −22.5 mV (gray line). The maximum conductance was determined from the linear part of the curve, between −2 and 6 mV, obtained after diffuse light illumination in control Ringer's solution, and was normalized to 1.0. The data point at +6 mV in CNQX was omitted for curve fitting.