Figure 2.
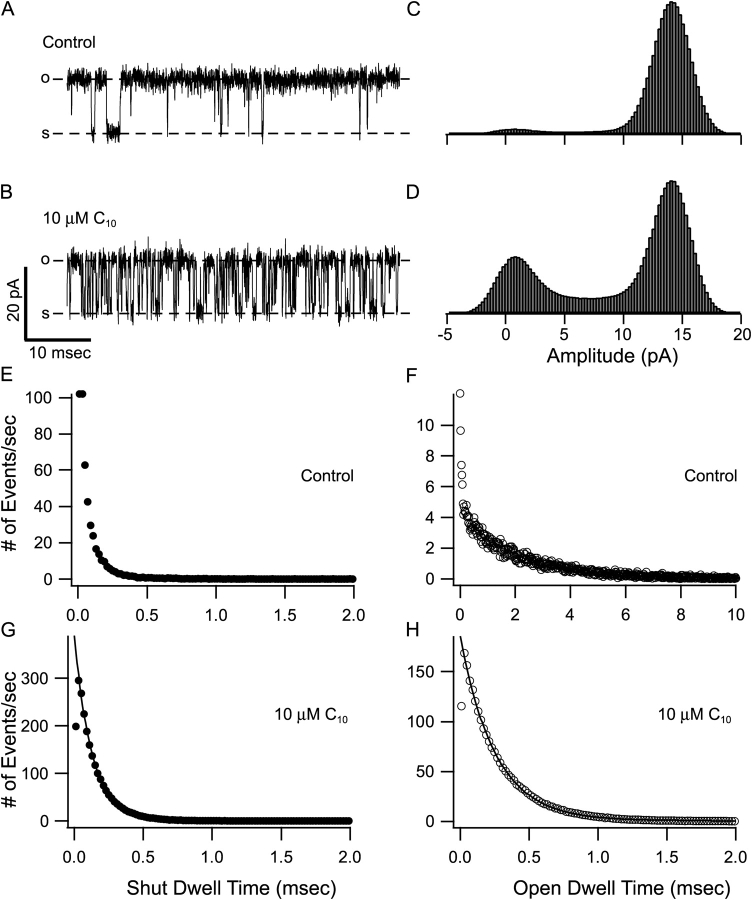
C10 block of BK currents demonstrates fast kinetics at single-channel level. A and B are representative segments of single BK currents before and after the application of 10 μM C10. Currents were recorded at 60 mV from an inside-out patch containing a single BK channel. The dashed lines labeled with “o” and “s” indicate open and shut levels. All-point amplitude histograms for 30 s of recording before and 100 s of recording after the application of 10 μM C10 are shown in C and D, respectively. Single-channel traces were idealized with half-amplitude threshold analysis. E and F show the distribution of shut and open dwell time from the idealization of 30 s of control record, while G and H from 100 s of record in the presence of 10 μM C10. For the ease of comparison, the y-axis in E–H was converted to number of events per second. Note the different x-axis scale in F. Data in G and H were each fitted (solid lines) with a single exponential function: y = Aexp(−x/τ) + b. Calculated dead time for half-amplitude threshold analysis at 10 kHz is 17.9 μs. Only dwell times >40 μs were used for fitting. Data in G were fitted with A = 389, b = 0.44 and τ = 127 μs. Data in H were fitted with A = 185, b = 0.45 and τ = 253 μs.

