Figure 7.
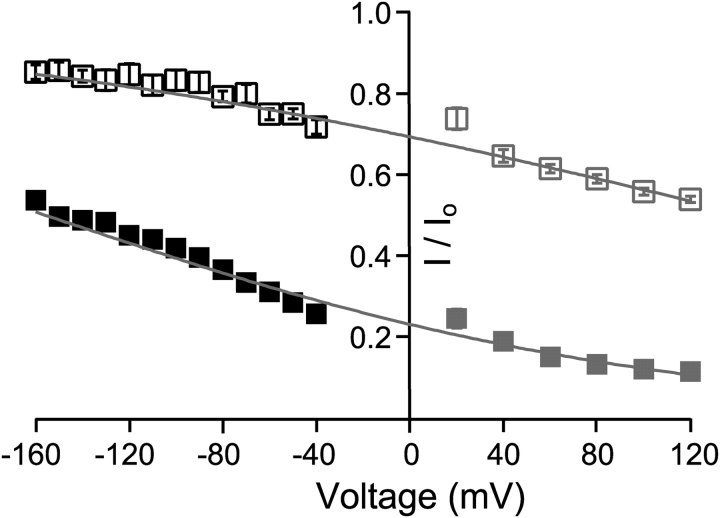
Reduction of peak tail currents suggests fast block at negative membrane potentials. Remaining fractions of steady-state currents shown in Fig. 3 B are replotted in gray (10 μM C10: open squares; 100 μM C10: filled squares), with the fitting of voltage dependence (gray lines) extrapolated into the negative membrane potentials. The black symbols are the remaining fractions of peak tail currents after the application of 10 μM (open squares) or 100 μM C10 (filled squares). Each data point represents the mean ± SEM determined from 6–7 patches. Note that error bars are often smaller than the symbols.

