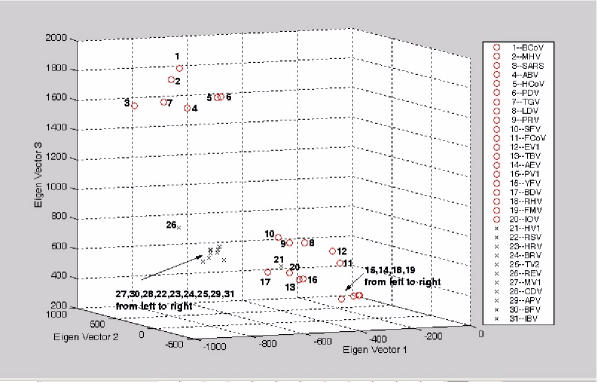
Figure 5.
3-D plot for the vectorial profiling of each virus onto the three eigen-vectors. The tetra-nucleotide usage patterns table in the additional file 2 (entire genome) for each virus have been redisplayed on the 1st, 2nd and 3rd eigen-vector axes ('o' represents positive strand ssRNA virus; 'x' represents negative strand ssRNA virus). The two families of viruses clustered into three different regions of the plot.

