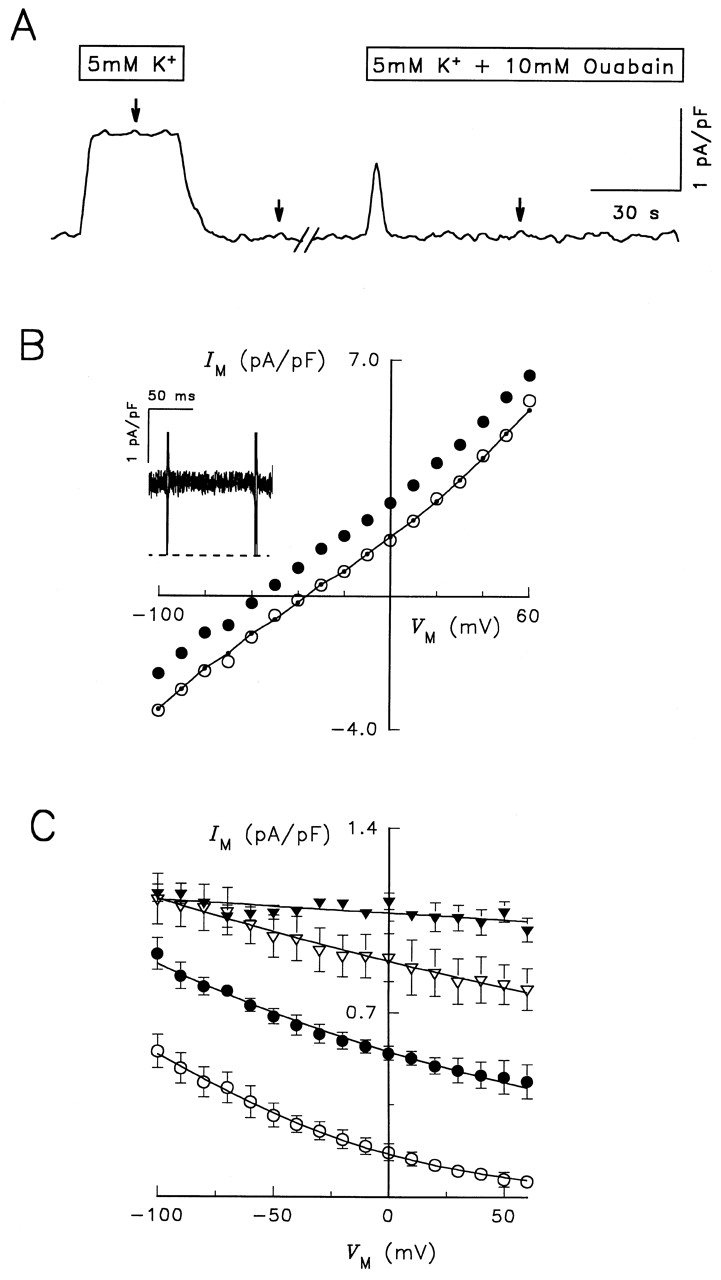
Figure 1.

Electrophysiological characterization of RD control enzyme. (A) Continuous current record during typical experimental manipulations. The cell was voltage clamped at the holding potential of −40 mV and superfused with the Na+- and K +-free, TMA-containing solution described in materials and methods. After 5 min in the presence of 1 μM ouabain, the concentration of K + o was increased to 5 mM for 25 s. K + o-free solution followed for 1–2 min before switching to a solution containing 5 mM K + plus 10 mM ouabain for 2 min. Current was low-pass filtered at 10 Hz and sampled at 25 Hz. Arrows over the trace indicate when voltage clamp pulses from −100 to +60 mV were elicited. (B) Steady state I-V relationships in the presence of 0 K + o (○), 5 mM K + o (•), and 5 mM K + o plus 10 mM ouabain (•–•). Symbols represent the average current measured during the last 50 ms of 100-ms-long voltage-clamp pulses. (Inset) Superimposed difference current records calculated by subtracting currents measured in K +-free solution from those in 5 mM K + o-containing solution. Traces were recorded during voltage-clamp pulses, as indicated by the brief current spikes, to −100, −60, −20, 0, +20, and +60 mV. Current records were not averaged. The dashed line represents zero-current level. Cell capacitance was 40 pF. (C) V M and K + o dependence of Na,K -pump current. The maneuvers described in A and B were applied during superfusion with solutions containing 0.02 (○), 0.2 (•), 1 (▿), and 5 mM K Cl (▾). K + o-activated difference currents were obtained for each K + o concentration. Symbols represent the mean ± SEM of 14 experiments. Curves through the symbols are best-fit functions to an equation derived for a pseudo two-state model of the Na,K -ATPase (see equation A20 in Sagar and Rakowski 1994).
