Figure 2.
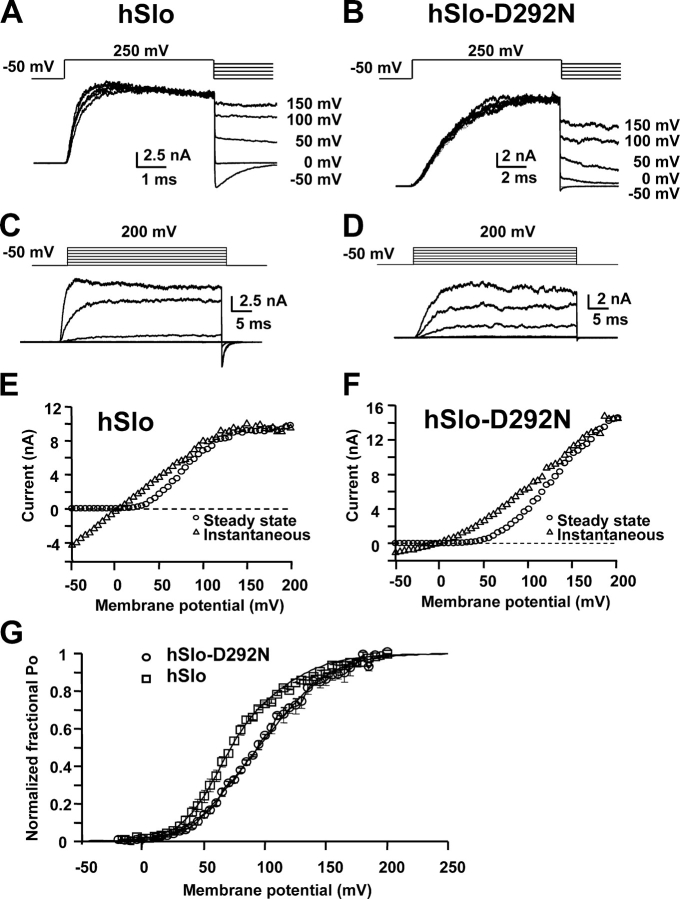
Shift to more depolarized potentials of the voltage activation curve by the D292N mutation. (A and B) Current traces elicited by pulses to 250 mV followed by repolarizations to the indicated potentials, for hSlo (A) and hSlo-D292N (B). (C and D) Current traces elicited by 40-ms voltage steps to −50, 0, 50, 100, 150 mV from HP-50 mV (same patches as in A and B). (E and F) Instantaneous (Δ) and steady-state (○) I–V relationships for hSlo (E) and hSlo-D292N (F). The instantaneous I–V curve was measured in tail currents 40 μs after repolarization. hSlo channels have a more pronounced voltage-dependent block at positive potentials for both steady and tail currents. On the other hand, hSlo-D292N channels have a strong reduction of the instantaneous conductance at potentials more negative than +50 mV. (G) fPo vs. voltage relationship for hSlo (○) and hSlo-D292N (Δ). Averaged data points (n = 3) were fitted to a double Boltzmann distribution. The parameters of the fitting are Z1 = 1.7, Z2 = 1.1, V1/21 = 61 mV, V1/22 = 111 mV, A1 = 0.65 (hSlo) and 0.30 (hSlo-D292N), A2 = 0.35 (hSlo) and 0.70 (hSlo-D292N). Inside-out membrane patches in 120 mM symmetrical K+ and 1.5 μM free [Ca2+].

