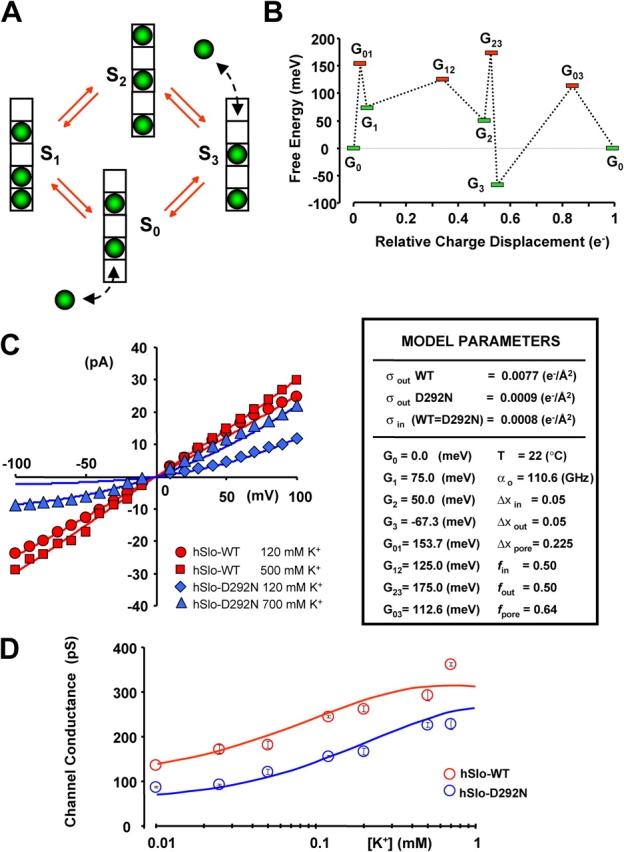
Figure 6.

A conduction model for hSlo and hSlo-D292N channels. (A) State diagram for a cyclic four-state model illustrating the metastable states of pore occupancy. The selectivity filter contains five K+ binding sites; K+ ions are depicted as green spheres. (B) Schematic free energy landscape for both hSlo and hSlo-D292N channels in standard conditions (symmetric 120 mM K+, no surface charge, and zero potential) during one permeation cycle. The landscape illustrates the free energy of the entire system “pore + ions” in different state of occupancy. The minima (G0–3) are to the energies of the metastable states S0–3. The maxima (G01–12–23–03) are the transition energies. Results of model fitting to experimental data are shown in C and D. (C) Experimental (symbols) and fitted (lines) single channel I–V curves for WT hSlo (red) and hSlo-D292N (blue) at indicated symmetrical [K+]. (D) Experimental (symbols) and fitted (lines) single channel chord conductance vs. [K+] for hSlo (red) and hSlo-D292N (blue). The insert shows the model parameters. α0 is the preexponential factor; G0–3 are the free energies of the states S0–3; G01–12–23–03 are the transition state energies; Δx in and Δx out, are the fractional voltage drops on internal and external ion entry, respectively; Δx pore is fractional voltage drops between two K+ binding sites within the pore; σout and σin are the external and internal surface charge densities, respectively. f is the position of the transition barriers. See for detailed description of model parameters.
