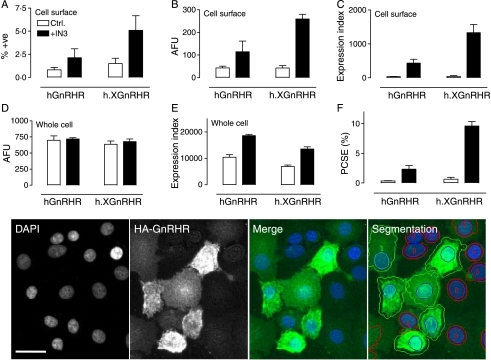
Figure 2.
GnRHR localization at matched whole cell expression levels. MCF7 cells were treated as described for Fig. 1 except that they were incubated for 16 h with 0 (open bars) or 1·8×10−7 M IN3 (filled bars) before staining for HA-tagged receptors in intact (cell surface) and permeabilized (whole cell) cells as indicated. The figure shows the proportion of cells with cell surface staining (%+ve, panel A), the cell surface staining in those cells (AFU, panel B), and the expression index calculated by compounding these values (panel C). Fluorescence intensity and expression index were also determined for whole cell staining (panels D and E respectively) and used for calculation of the proportion of receptors at the cell surface (proportional cell surface expression, PCSE, panel F). These data are from the experiment shown in Fig. 1 (mean±s.e.m., n=4) with Ad titers selected for comparable whole cell expression levels (300 pfu/nl for Ad hGnRHR and 100 pfu/nl for Ad h.XGnRHR). Parallel experiments with the XGnRHR (100 pfu/nl) yielded PCSE values of 39·1±5·9 and 59·1±25·6 in control and IN3-treated cells respectively. Two-way ANOVAs of the graphed data revealed IN3 as a significant variable for each measure except for AFU in whole cells (e.g., P<0·05 for panels A–C, and F, but not for panel D). The lower panel images show representative views of DAPI-stained nuclei and HA-GnRHR expressing cells as well as merged images. Segmentation is also shown (lower right) to illustrate how the individual cells were filtered to identify HA-GnRH positive cells (green outlines, AFU >10% above background) and negative cells (red outlines, AFU <10% above background). Full colour version of this figure available via http://dx.doi.org/10.1677/JOE-07-0471. The horizontal scale bar (DAPI image) is ∼20 μm.

