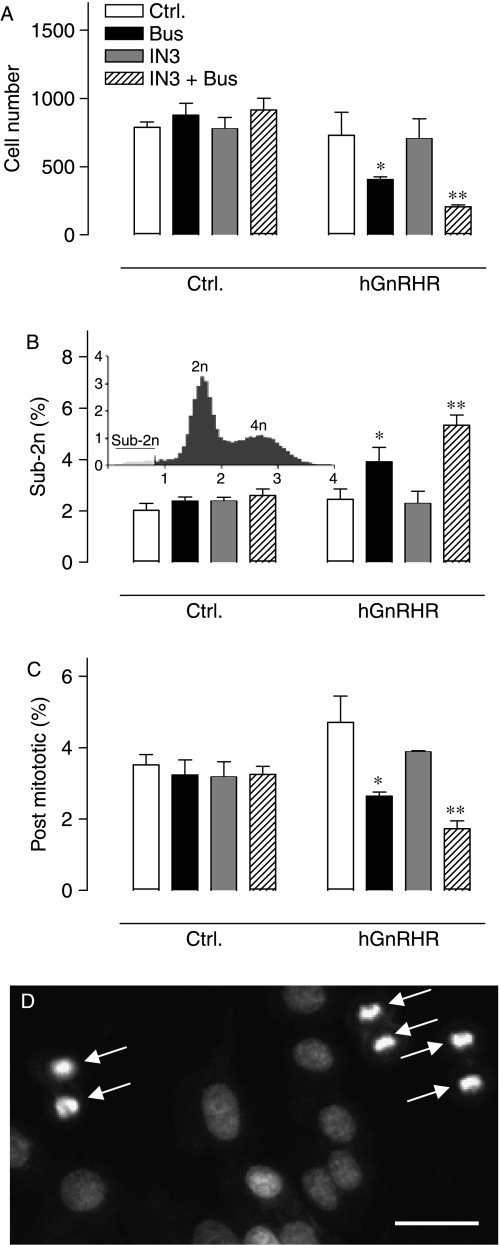
Figure 8.
Effects of Buserelin and IN3 on cell number and nuclear stains. Control and Ad hGnRHR infected cells were cultured in medium with 2% FCS with or without Buserelin (10−7 M) and IN3 (1·8×10−7 M) as indicated, prior to staining and imaging to determine cell number (in the imaged area of 2·4 mm2) as well as the proportion of sub-2n and post-mitotic cells. The bar charts are from a single representative experiment (mean±s.e.m., n=4, *P<0·05, **P<0·01 by Student's t-test). Analysis of data pooled from three similar experiments by two-way ANOVAs revealed that Buserelin was not a significant variable in control cells but was in Ad hGnRHR-infected cells (P<0·01), and in Ad hGnRHR-infected cells the reduction of cell number was greater in cells treated with IN3 and Buserelin than in cells receiving Buserelin alone (P<0·05 by Student's t-test). The inset in panel B shows a distribution profile with integrated nuclear stain intensity on the horizontal axis (arbitrary fluorescence units) and cell number (in thousands) on the vertical axis, demonstrating the 2n and 4n cell populations and the arbitrary cut-off (<50% of the 2n peak) used to define sub-2n cells. Panel D shows a small proportion of the image captured from a single well, illustrating the small and highly stained nuclei that were characteristically seen in pairs and identified by the analysis algorithm as post-mitotic (anaphase) cells (arrows). Horizontal scale bar=∼20 μm.

