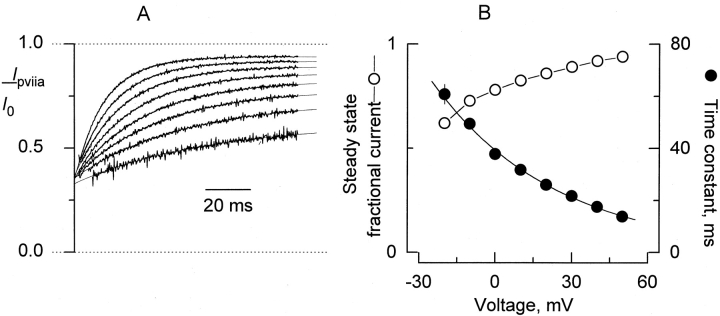
Figure 2.
Voltage dependence of κ-PVIIA inhibition. (A) After leak subtraction, records taken in the presence of 100 nM κ-PVIIA at each pulse voltage (Fig. 1 B) were divided point-by-point by leak-subtracted control record taken at corresponding voltages. Shown are the results of such an operation for the interval 2–100 ms after the beginning of the 0 to +50 activating pulses. For the pulses to −10 and −20 mV, the points intervals 15–100 and 18–100, respectively, are shown. The thin lines correspond to fits of an exponential equation of the from:  , where a, b, and τ correspond to the steady state fractional current, the amplitude extrapolated to the beginning of the pulse, and the time constant, respectively. Note that the I
PVIIA/I
control curves converge to similar values when extrapolated to the beginning of the activating pulse. The mean ± SEM value is: 0.35 ± 0.004 for the −10- to +50-mV pulses. These values correspond to the resting inhibition at holding potential. (B) Plot of the results from the kinetic analysis shown in A. Plotted, as mean ± SEM for four separate experiments, are the time constant and steady state fractional current, (I
PVIIA/I
control)∞, as a function of the activating pulse voltage (a and τ in A). The continuous line over the time constant data (•) was drawn according to with
  .
.

