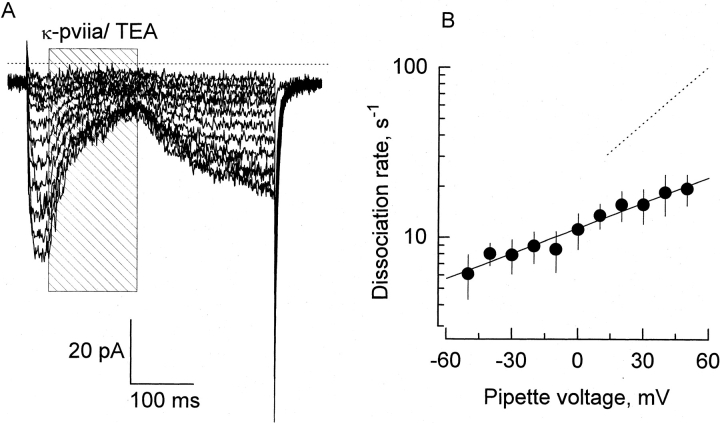
Figure 8.
Effect of internal K+ removal on the dissociation rate of κ-PVIIA. (A) Pulse application of 1 mM TEA+/500 nM κ-PVIIA (shaded area) to an outside-out patch. External solution contained 100 mM K+ and the pipette was filled with 100 mM NMG+ (0-K
in//100-K
ex; see methods). Pipette potential was maintained at −90 mV and 400-ms pulses were applied from −70 to +50 in 10-mV increments. These records represent the average of four identical traces. The dotted line is the zero current level. (B) Voltage dependence of the dissociation rate in the absence of internal K+. A single exponential function was fitted to each time course of current recovery after toxin removal. Dissociation rate constants were calculated from the reciprocal of the resulting time constants. The solid line was traced with the following parameters:  . Each data point represents mean ± SEM for four different patches. For comparison, the dashed line represents the voltage dependence of the dissociation rate measured in whole oocyte bathed in 100 mM external K+
 .
.

