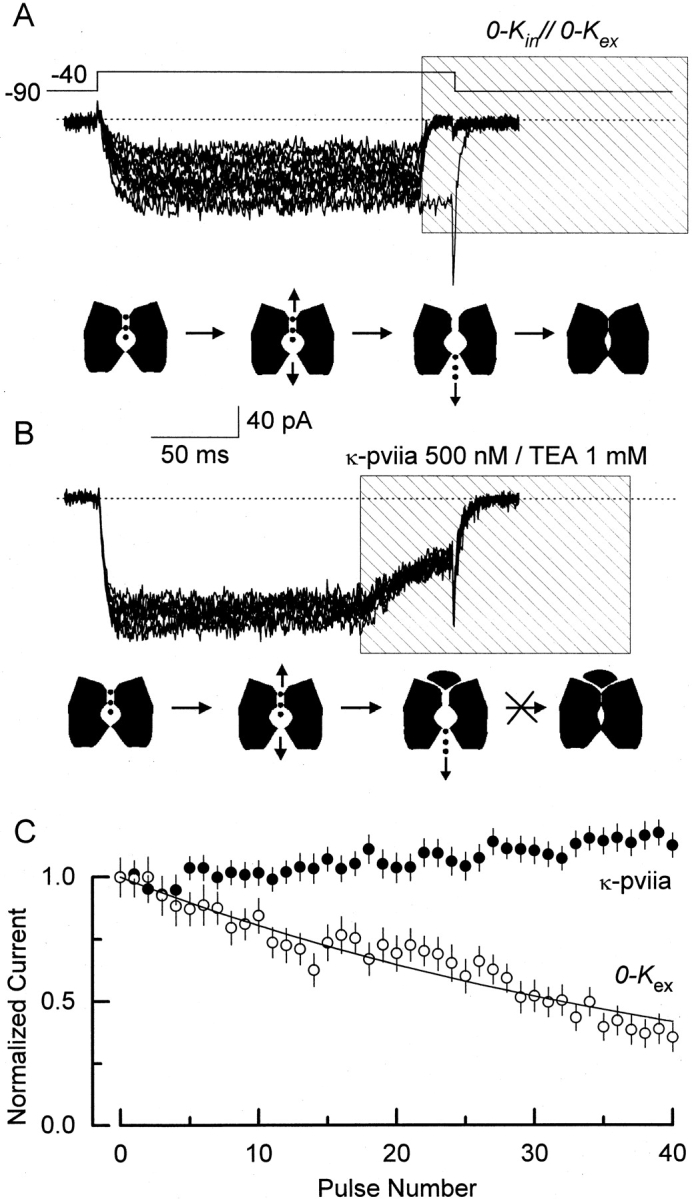
Figure 9.

κ-PVIIA protects the Shaker pore from collapsing. Traces show 10 current records from outside-out patches with 100 mM external K+ and 100 NMG+ in the pipette (0-K in//100-K ex, see methods). Except for the initial control in A, traces shown correspond to one in every four acquired. The dotted line indicates the zero current level. The lower cartoon under each set of traces depicts the kinetic states that the Shaker K channels are putatively visiting during the experimental protocol: closed, open-conducting, open-empty, and pore-collapsed. (A) Exposing channels to zero potassium produces a cumulative reduction of the current. Every 5 s, the pipette voltage was stepped from −90 to −40 mV for 200 ms to open channels. After an initial control trace, distinguished by the inward tail current, ∼15 ms near the end of the depolarization, the pulse of a zero K+ solution is given (0-K in//0-K ex). We estimated that the channels are exposed for 5–8 ms to this 0-K in//0-K ex experimental condition. During this time, K+ residing in the pore are allowed to escape, reducing the channel pore occupancy. The fraction of channels not entering nonconductive state(s) promoted by this experimental manipulation is plotted (C, ○). (B) Exposing channels to toxin does not produce reduction in the current. Similar to A, every 5 s, the pipette voltage was stepped from −90 to −40 mV for 200 ms to open channels. At ∼150 ms after the beginning of the voltage pulse, a 150-ms long TEA+/toxin pulse was applied to block the channels (shaded area). During this period, ions residing in the pore of the open/blocked channel are expected to escape away into the intracellular side of the channel. The activating voltage pulse ends when ∼60% of the channels are blocked and near equilibrium. The toxin residence time at this voltage is three orders of magnitude larger than that of possibly the last occupying ion (150 μs vs. 150 ms, see Fig. 8 B; Baukrowitz and Yellen, 1996). Also, this residence time is 20–30-fold larger than the 5–8 ms of exposure to zero K+ needed to observe reduction in the current as shown in A. If the toxin does not protect, and if the 60% toxin binding at the end of the pulse is in equilibrium for more than 5–8 ms, at least a 40% reduction in the current is expected to be produced at the 40th pulse. This is a very conservative low limit that was obtained from the exponential fitting to the 0-K ex data in C. (C) Fractional current averages of non–leak-subtracted records. Averages were measured in the 50–100-ms interval after the beginning of the voltage pulse for both experimental conditions and the error bars represent SD in each interval. A solid line was drawn according to a single exponential with a decay constant of 44 pulses.
