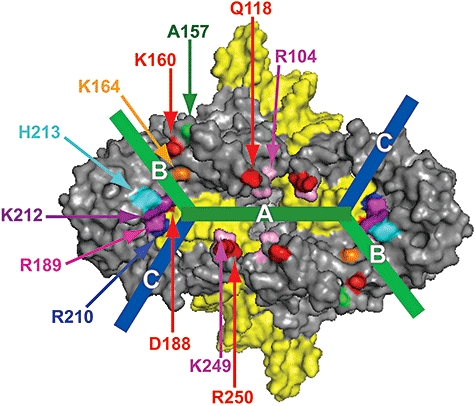
Fig. 1.

Potential DNA binding regions in Tn5 synaptic complex. A view of the synaptic complex cocrystal structure. The Tnp surface is represented in grey, while the DNA surface is shown in yellow. The Tnp active site is represented by D188. Labelled positions represent the location of amino acid substitutions in this study with the exception of amino acid A157. Amino acid A157 corresponds to C134 in Tn10 which was shown to decrease target insertion specificity in Tn10 transposition (Bender and Kleckner, 1992b). Prospective DNA binding channels are shown as lines and are labelled, A (the prospective 9 bp target site binding region, green), B (light green) and C (blue). Channels B and C represent possible binding regions for flanking target DNA and dbb DNA.
