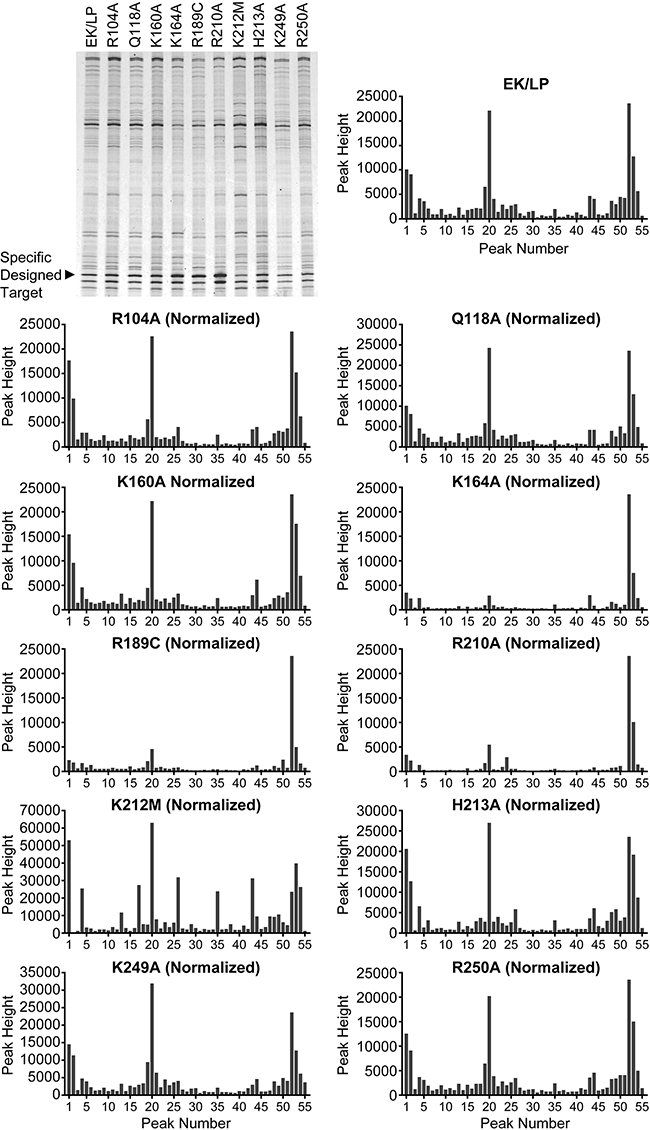
Fig. 3.

In vivo/in vitro target insertion profile library. The DNA insertion profile library (as described in Fig. 2C) was analysed via 6% denaturing PAGE. Each insertion profile library generated a pattern of bands representing individual insertion events. The specific insertion into the designed 9 bp insertion site is shown. The insertion profile window is ∼300 bp in length. The peak height of the specific insertion event was normalized for each mutant Tnp to the peak height of the control specific event which corresponds with peak 53. Note the large insertion density present at peak 20. This peak corresponds with an insertion site native to plasmid pGRT2 that was not designed. This native site shares sequence elements with the designed 9 bp target site (GGTTATAGG). The location of this native insertion site is denoted in Fig. 2A. A decrease in the secondary peaks as compared with the specific insertion peak represents an increase in target specificity. K164A, R189C and R210A led to large increases in specificity. K212M led to a slight, but reproducible decrease in specificity and an increase in random insertion events (over the span of this insertion window).
