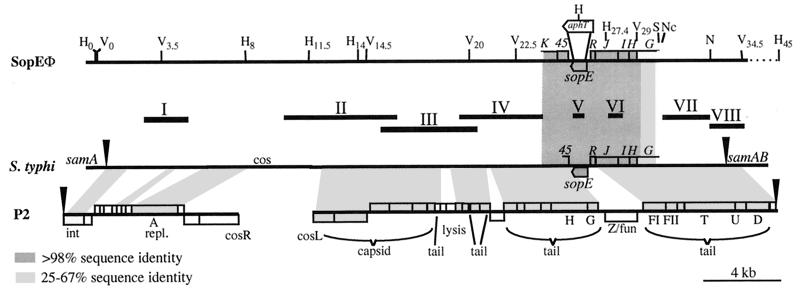
Figure 2.
Restriction map of SopEΦ. Alignment of the SopEΦ-pro-phage of S. typhimurium 3351/78DT204;E+ with the sopE-region from S. typhi (boxed region: our own sequencing results = accession no. AF153829; the rest is part of a contig produced by the Pathogen Sequencing Unit at the Sanger Centre; http://www.sanger.ac.uk/Projects/S_typhi; arrowheads, predicted integration site in samA) and phage P2 (accession no. AF063097; split at the attachment site = arrowheads); solid bars, probes for Southern analysis of the SopEΦ-pro-phage (see Table 2). The restriction map of the SopEΦ-pro-phage includes all recognition sites for H (HindIII) and V (EcoRV) and some recognition sites for S (SacII), Nc (NcoI), and N (NdeI). Subscript numbers indicate their relative positions (in kb). aphT, position of the resistance cassette in sopE∷aphT-Φ. The sequence similarity (tblastx server at the Sanger Center) between ORFs of P2 or the sequenced part of the SopEΦ-pro-phage (boxed region) to predicted polypeptides encoded by the S. typhi sequence is indicated: white (no significant similarity), light gray (25–67% identity), or dark gray (>98% identity). The shaded trapezoids indicate the location and the degree of similarity of similar regions.

