
Fig. 1. Qualitative screen for mutants with fewer dead cells. Cultures of the mutants, WT and controls were spotted onto agar plates containing PI, and screened visually in the microscope. Images are 40× magnification grey-scale pictures taken with simultaneous phase contrast and fluorescent light. Bright cells represent dead cells stained with PI; mutants with altered numbers of dead cells are identifiable by this method.
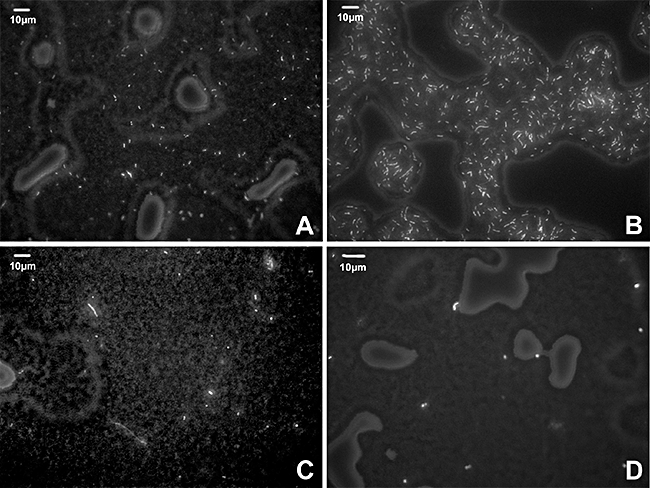
A. WT control strain.
B. Control rpoS mutant showing increased cell death.
C. Decreased death mutant fliA.
D. Decreased death mutant rssB.