
Figure 4.
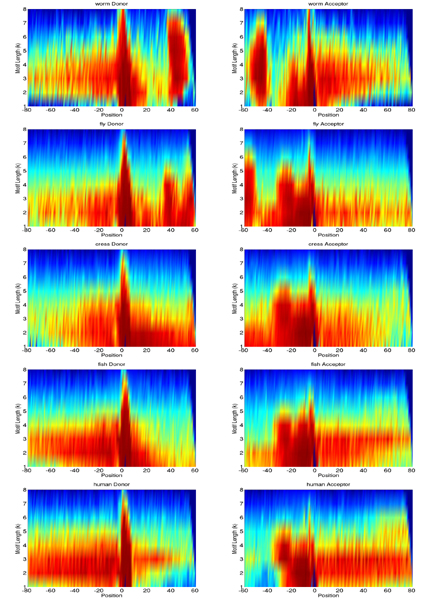
k-mer scoring matrices comparatively for worm, fly, cress, fish, and human. They depict the maximal position-wise contribution of all k-mers up to order 8 to the decision of the trained kernel classifiers, transformed into percentile values (cf. the section on interpreting the SVM classifier). Red values are highest contributions, blue lowest. Position 1 denotes the splice site and the start of the consensus dimer.