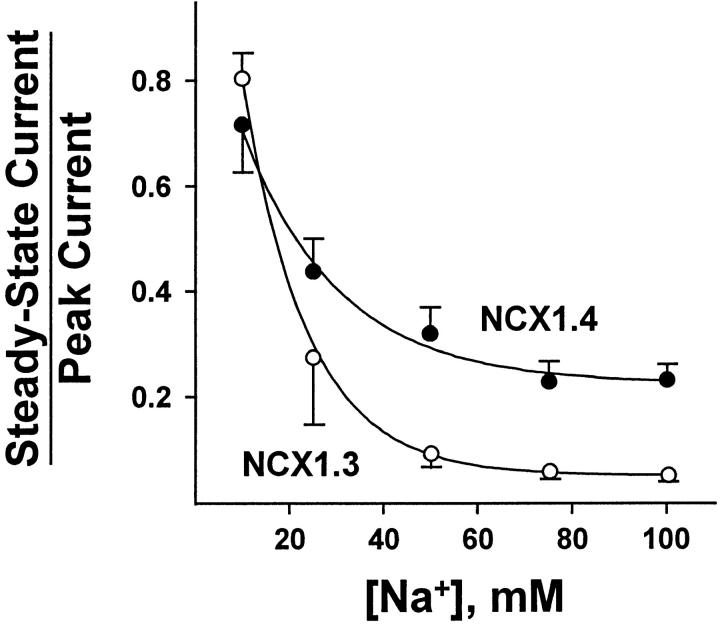
Figure 4.
Na+ i dependence of the ratio of steady state to peak current for NCX1.4 and NCX1.3. Currents were obtained as described in Fig. 2. Data are mean ± SEM of 8–20 determinations from 16 patches for NCX1.4, and 4–12 determinations from seven patches for NCX1.3.

