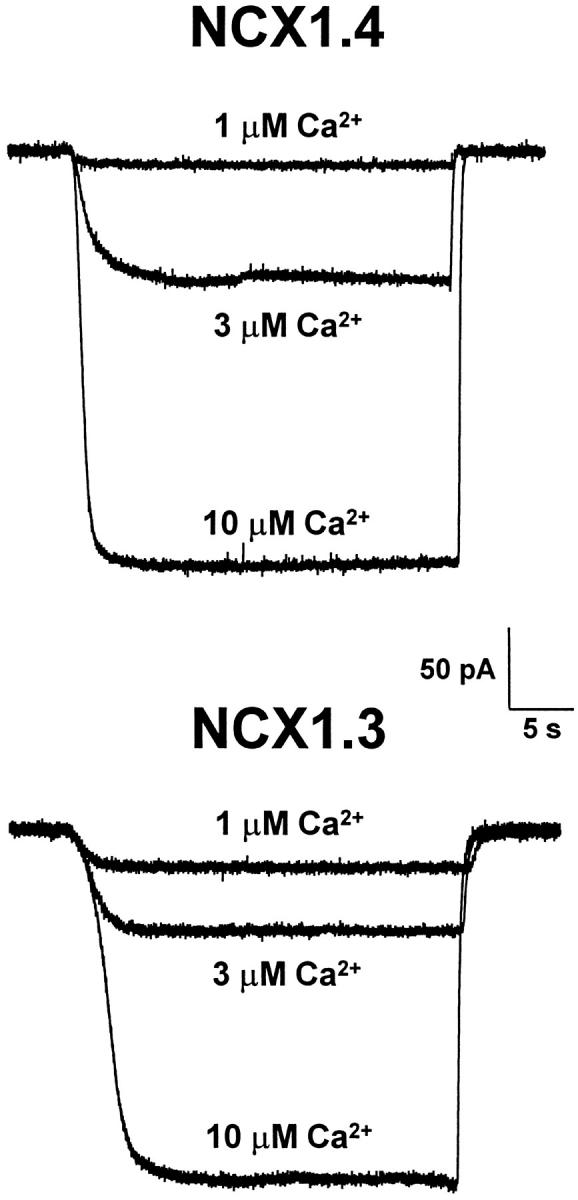
Figure 9.

Representative inward Na+–Ca2+ exchange currents produced by NCX1.3 and NCX1.4 are shown in response to the application of three different Ca2+ concentrations (1, 3, and 10 μM). Pipettes contained 100 mM Na+. Similar results were obtained in four additional patches for NCX1.3 and two additional patches for NCX1.4.
