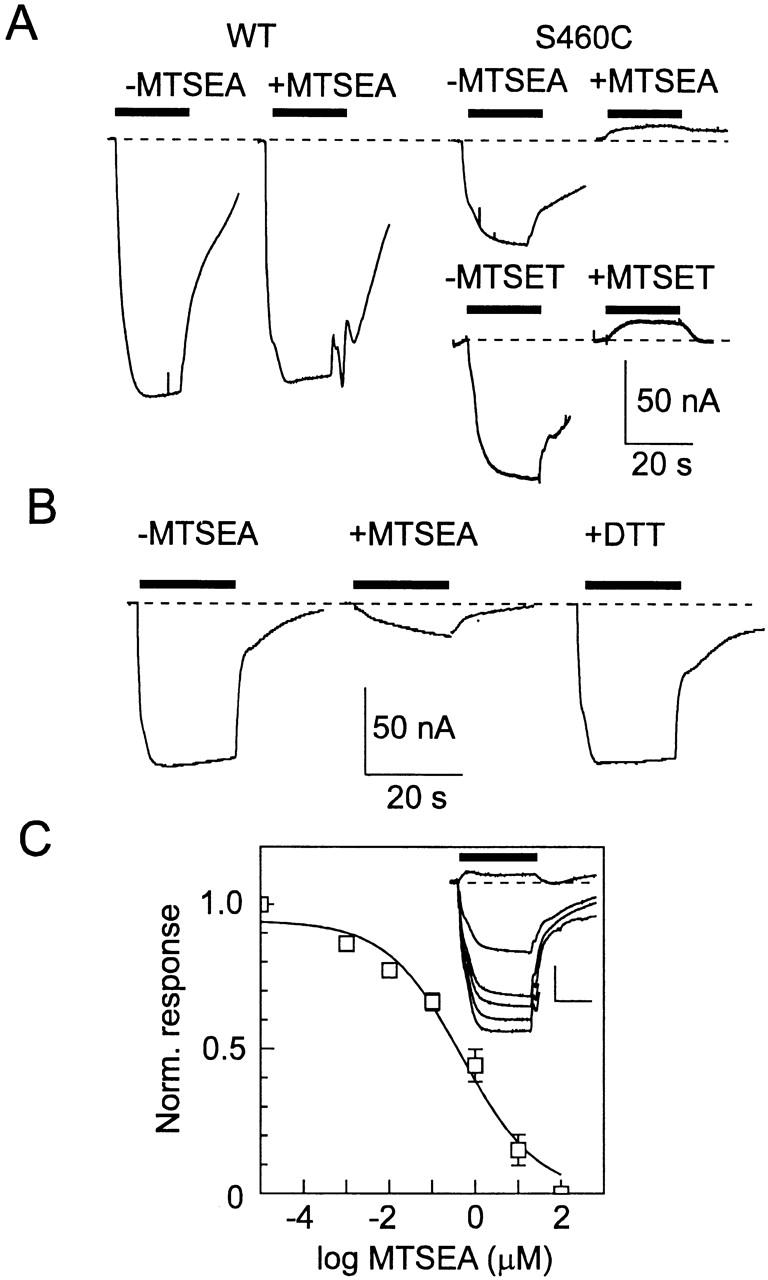
Figure 2.

Alkylation using MTSEA leads to a suppression of the electrogenic response in oocytes expressing mutant S460C. (A) Comparison of the Pi-induced current for an oocyte expressing the WT NaPi-IIa before and after exposure to 100 μM MTSEA (left) and two oocytes expressing S460C before and after exposure to 100 μM MTSEA or MTSET for 2 min (right). Bars represent time of application of 1 mM Pi. Dashed line indicates baseline holding current level. Note that Pi induces an upward deflection in the holding current after alkylation. (B) Restoration of Pi response by 15-min incubation in 10 mM DTT (right) for a cell expressing S460C. Incubation in 1.5 μM MTSEA exposure (middle) inhibited the initial Pi response (left) by 80%. (C) Dependency of the Pi response on MTSEA concentration. Inset gives a set of original records showing Pi response (applied during bar) for an oocyte expressing S460C after exposure to successive 10-fold increasing doses of MTSEA from 0.001 to 10 μM. Scale: vertical 50 nA, horizontal 20 s. For this cell, after exposure at 10 μM MTSEA, Pi induced an upward deflection of the baseline current. There was no change in the response after exposure to 100 μM MTSEA. Dose response is pooled from five oocytes. The Pi-induced response was calculated relative to the Pi-induced current after alkylation in 100 μM MTSEA, and was then normalized to the initial response for each cell. Curve is a fit of to the data, which gave an apparent half-maximal concentration = 0.5 μM.
