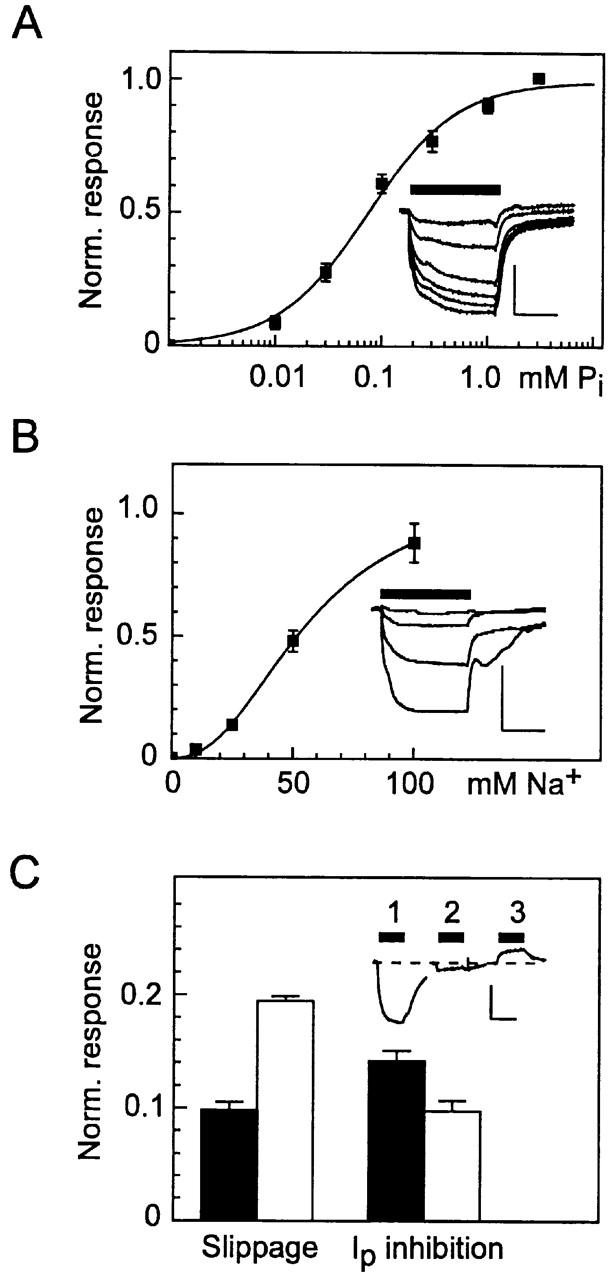
Figure 4.

Steady state kinetics of oocytes expressing S460C. (A) Pi dose response determined from original records such as shown in the inset (scale: vertical, 50 nA; horizontal, 10 s) at 100 mM Na+. Data points are pooled from four oocytes from the same batch. was fit to the dose–response data for each cell and the data points were normalized to the predicted maximum current. Continuous line is refit of to the pooled data, giving a Hill coefficient, nPi = 1.04 ± 0.07 and apparent Pi affinity, K m Pi = 0.081 ± 0.01 mM. (B) Na+ dose response determined from original records such as shown in the inset (scale: vertical, 50 nA; horizontal, 10 s), at 1 mM Pi. Data points are pooled from three oocytes from the same batch. Data were treated as in A. Fit of (continuous line) gave a Hill coefficient nNa = 2.35 ± 0.21 and apparent Na+ affinity K m Na = 56.3 ± 4.0 mM. (C) Effect of PFA on the slippage mode (left) and cotransport mode (right) for WT (filled bars) (n = 9) and S460C (open bars) (n = 5). Inset shows an original recording from a cell expressing S460C: (1) response to 0.3 mM Pi, (2) response to 0.3 mM Pi and 3 mM PFA, (3) response to 3 mM PFA. Traces have been aligned to the baseline current in the absence of substrate (dashed line). For the slippage mode assay, bars represent the ratio of trace 3 response to trace 1 response. For cotransport mode assay, bars represent the ratio of trace 2 response to trace 1 response, both relative to the level in the presence of PFA alone (trace 3).
