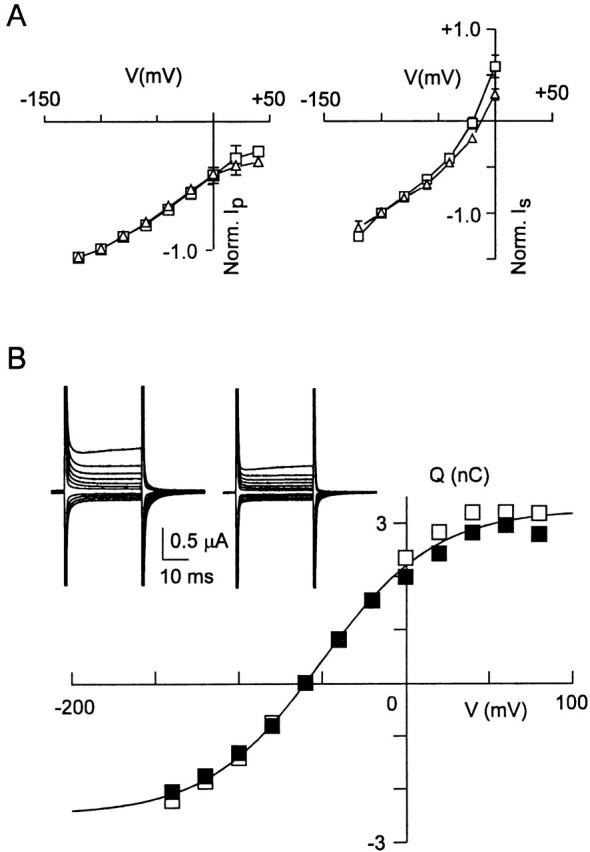
Figure 5.

Mutant S460C and wild type show comparable voltage dependence. (A) Steady state current–voltage curves for representative cells expressing wild type (□) and S460C (▵) for the cotransport (left) and slippage (right) modes. For cotransport mode, the current (I p) represents difference between current induced by 1 mM Pi and current in absence of Pi normalized to the value at −100 mV (n = 4). For slippage mode, the current (I s) represents difference between the holding current and current induced by 3 mM PFA, normalized to the value at −100 mV (n = 4). SEMs smaller than symbol size are not shown. (B) Pre–steady state relaxations induced by voltage steps from −60 mV holding potential to voltages in the range −140 to +80 mV in ND100 solution. Inset shows original records before (left) and after (right) application of 3 mM PFA. Q–V curve found by integrating the transient current after subtraction of the PFA response. (▪) ON charge movement, (□) OFF charge movement. Continuous line is fit of to mean of ON and OFF charges, which gave fit parameters: Q max = 5.7 nC, z = 0.7; V0.5 = −51 mV.
