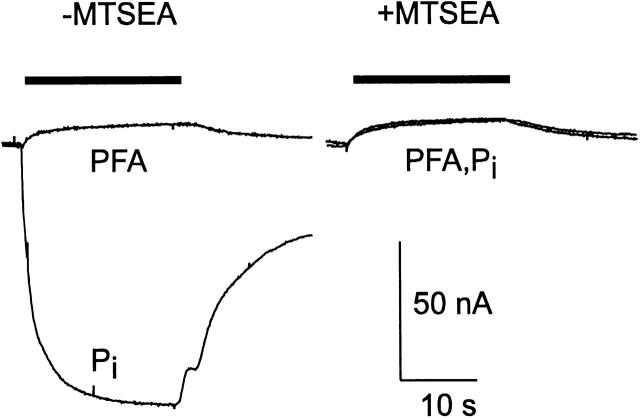
Figure 6.
Effect of alkylation by MTSEA on Pi and PFA response for cells expressing S460C. Substrate was applied during the period indicated by the bar. Cell was voltage clamped to −50 mV. Note that after alkylation, the 3 mM Pi and 3 mM PFA responses superimpose and are identical to the PFA response before alkylation. Vh = −50 mV.

