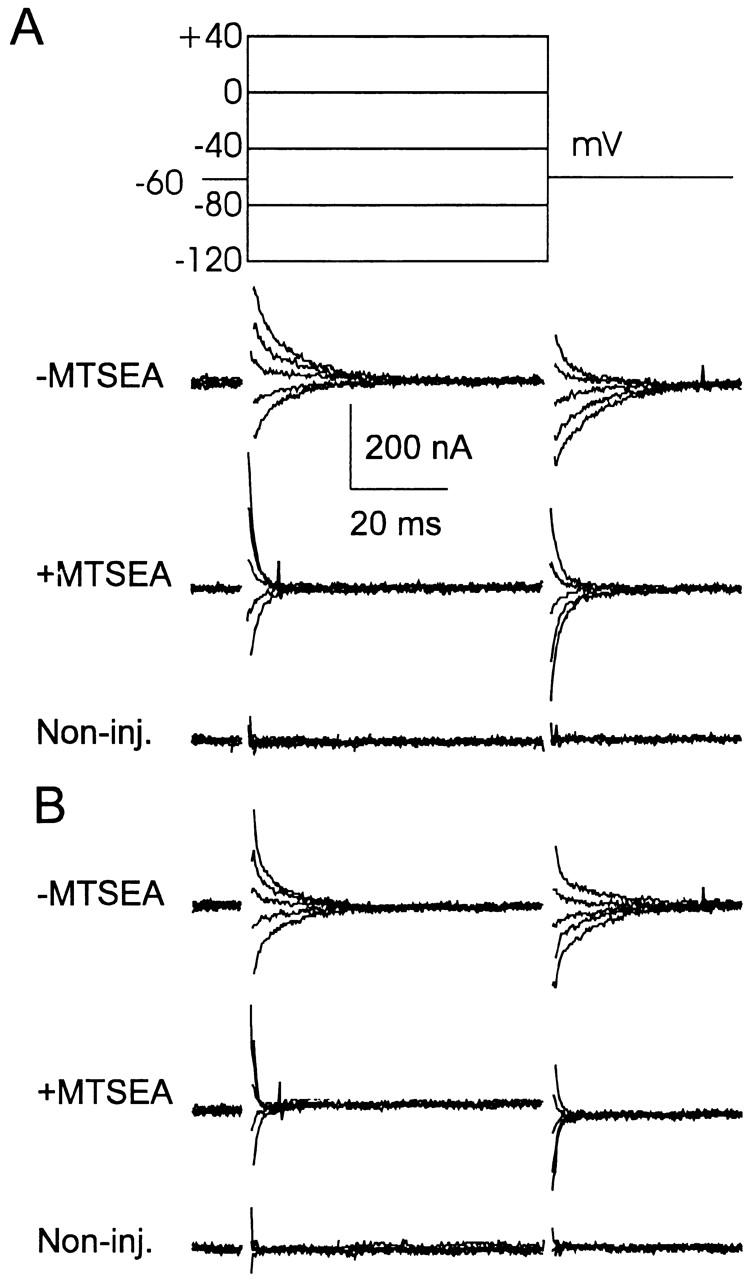
Figure 7.

Pre–steady state charge kinetics are faster after MTSEA incubation. Recordings of pre–steady state relaxations from a representative oocyte expressing S460C, superfused in ND100 solution (A) and ND0 solution (B) before MTSEA application (100 μM, 2 min, top) and after MTSEA application (middle). Bottom traces were recorded from a noninjected oocyte from the same batch under the same superfusion conditions (without MTSEA). In each case, oocytes were voltage clamped at −60 mV holding potential and records are shown for voltage steps according to the protocol in A. Each record is the average of eight sweeps with records obtained in 3 mM PFA, 100 mM Na+ was subtracted to eliminate capacitive charging transient. Records were low-pass filtered at 2 kHz and sampled at 50 μs/point. All records were blanked for the first 1.5 ms during the charging period of the oocyte. For this cell, the response to 3 mM Pi before MTSEA was −100 nA, and after MTSEA it was +15 nA relative to the holding current at −50 mV.
