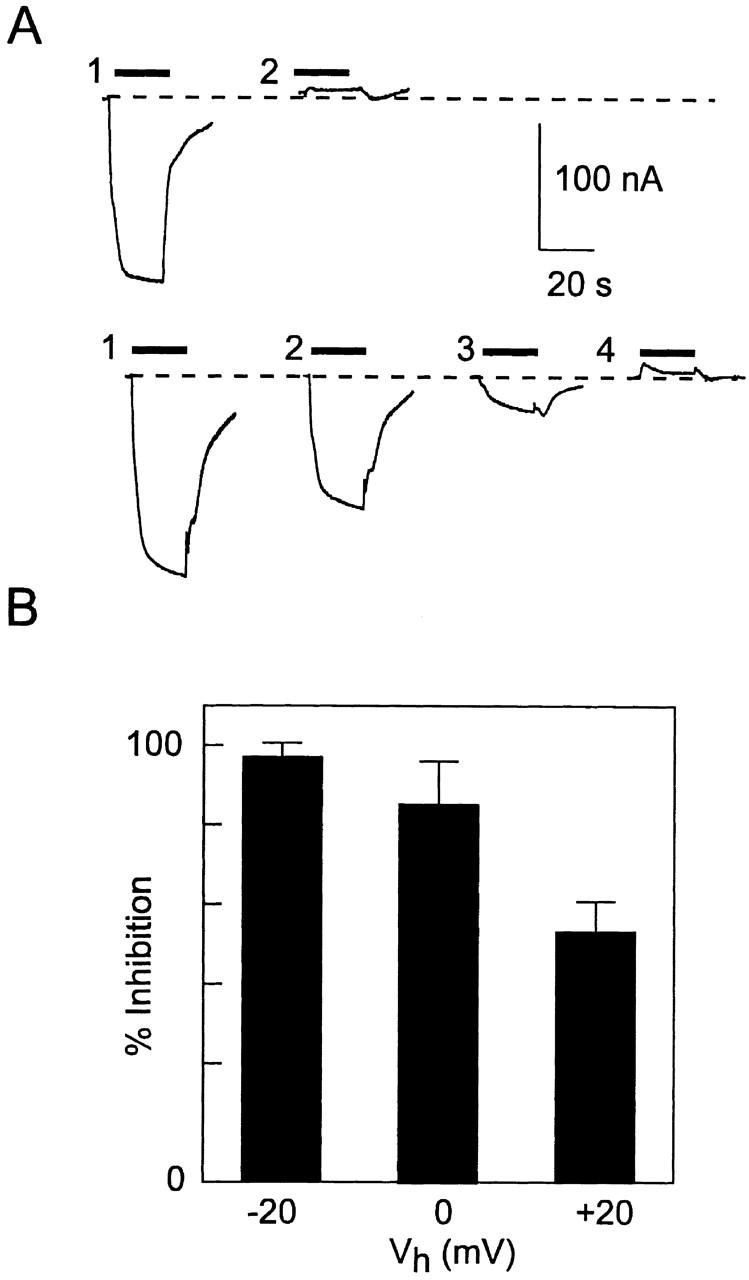
Figure 8.

Membrane potential protects against MTSEA suppression of Pi response only in the absence of external Na+. (A) Original recordings from two representative oocytes (top and bottom) from the same donor frog expressing S460C before and after a 2-min exposure to 10 μM MTSEA at different holding potentials. After alkylation, the response was tested each time with 1 mM Pi at −50 mV in ND100. (Top, 1) Initial response, (2) response after alkylation at +20 mV holding potential in ND100. (Bottom, 1) Initial response, (2) response after alkylation at +20 mV in ND0, (3) response after alkylation at −50 mV in ND0, (4) response after alkylation at −50 mV in ND100. The dashed line represents the initial holding current level before Pi application. (B) Pooled data of the inhibition of the Pi response after alkylation in 0 mM Na+, at three holding potentials. n = 3 (−20 mV, 0 mV); n = 5 (+20 mV). For all cells, after reexposure to MTSEA at −50 mV in ND100 solution, the Pi response was the same as the PFA response. The percent change in the Pi-induced electrogenic response was expressed as: 100 · [1 − (I p + + I s)/(I p − + I s)], where I p − and I p + are the Pi-induced current before and after MTSEA exposure, respectively, I s is the PFA-induced change in holding current (slippage current), with all currents expressed as magnitudes. It was assumed that the slippage was fully suppressed by 3 mM PFA so that the true Pi-induced response for saturating Pi was given by the change in current relative to the holding current during PFA exposure.
