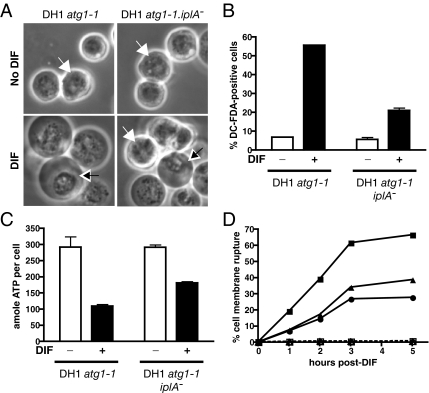
Figure 3.
iplA mutant cells showed partial inhibition of DIF-induced necrotic cell death. (A) Some DH1.atg1-1.iplA−(del) cells did not show necrotic cell death morphological features in response to DIF. DH1.atg1-1 and DH1.atg1-1.iplA−(del) cells were starved for 16 h, and then they were washed and further incubated in the presence of 100 nM DIF (DIF, bottom) or in its absence (No DIF, top). Phase contrast microscopy pictures taken 60 min after addition of DIF. White arrows, cells showing signs of necrotic cell death; black arrows, cells not showing such signs. (B) The percentage of DC-FDA–positive cells was less in iplA− than in iplA+ cells. Starved DH1.atg1-1 and DH1.atg1-1.iplA−(del) cells were incubated with DC-FDA, a fluorescent ROS-detecting probe, with or without DIF for 20–30 min, and fluorescent DC-FDA–positive cells were quantified by flow cytometry. (C) ATP depletion was less in iplA− than in iplA+ cells. Starved DH1.atg1-1 and DH1.atg1-1.iplA−(del) cells were incubated with or without DIF for 20–30 min, and quantification of ATP (in attomoles per cell) in each cell population was performed using the CellTiter-Glo Luminescent Cell Viability Assay kit. (D) The percentage of cells with DIF-induced plasma membrane rupture was less in iplA− than in iplA+ cells. Cell membrane rupture was detected and quantified as a function of time by flow cytometry in starved DH1.atg1-1 (squares) and two independent clones of DH1.atg1-1.iplA−(del) (circles; triangles) cells incubated either without (dotted line) or with DIF (continuous lines). The same percentage of cells (and presumably the same cells) show perinuclear clustering, DC-FDA fluorescence and later plasma membrane rupture.

