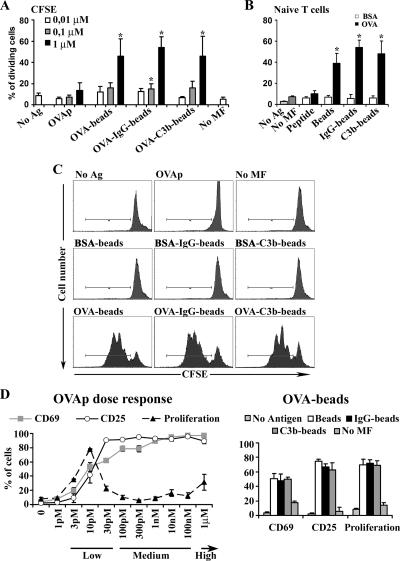
Figure 3.
Phagocytic macrophages induce CD8+ T-cell proliferation. CFSE-labeled T-cells were analyzed by flow cytometry for CFSE expression after 50 h of antigen presentation to estimate the number of T-cell divisions. (A) Dose-response assays of CFSE staining determined as the percentage of dividing cells. (B) Macrophages loaded with 1 μM BSA (□) or OVA (■) peptide or with differently opsonized beads. Macrophages depleted of granulocytes and naïve CD8+ T-cells were used. Data are expressed as arithmetic means ± SEM of four independent experiments; statistical comparisons were made with the Mann-Whitney test (*p < 0.05). Fold inductions of unloaded macrophages are presented. (C) Histograms of CFSE staining in CD8+ cells are shown from a representative experiment. (D) Dose-response assays comparing the numbers of CD69 and CD25 positive and proliferating T-cells after exposure to macrophages loaded with different concentrations of OVAp (left) or with 1 μM of differently opsonized OVA-beads (right).

