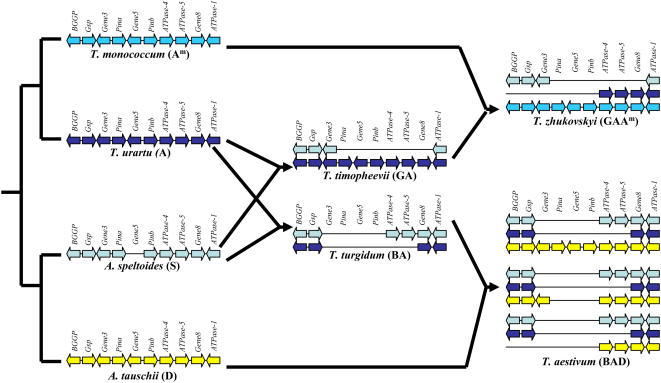
Figure 1.
Scheme for polyploid wheat phylogeny and changes in the Ha haplotype structure during their evolution. Solid arrows represent genes and their orientation, with symbols above. Species and their genome formulae are indicated underneath. Arrow size and spacing are not proportional to gene size or intergenic interval.

