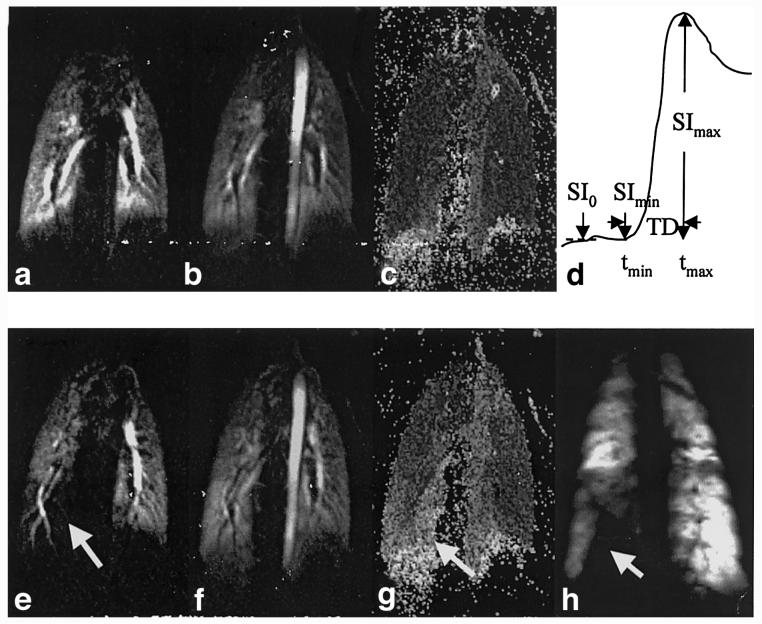
FIG. 3.
Images from lungs of a pig before (top row) and after (bottom row) creation of a ventilation defect. Images a and e are one slice from a 3D perfusion dataset. Images b and f are maximum intensity images (SImax) calculated from the dynamic perfusion datasets. Images c and g are time delay maps, as defined in the text, with hyperintensity representing longer delays. Image d schematically illustrates the definitions of the parameters in the calculated parametric maps. Image h was acquired postventilation-defect using 3He. The arrow in e, g, and h points to the region of defective ventilation.

