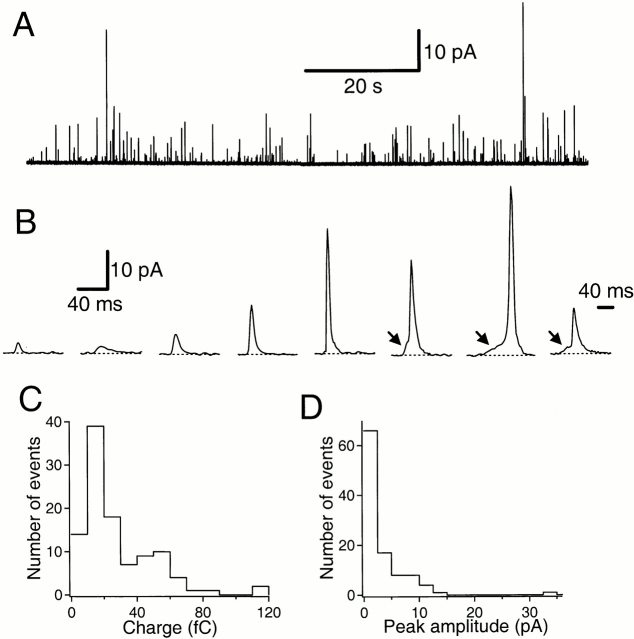
Figure 1.
Quantal secretory events detected in a dog pancreatic duct epithelial cell. (A) Representative amperometric signals. The cell was loaded in 70 mM serotonin solution and exocytotic events were monitored with a carbon-fiber electrode polarized at +600 mV in serotonin-free solution. (B) Quantal events from the same experiment plotted at higher time resolution. The arrows indicate “feet” preceding main spikes. The last event on the right is plotted on a different time scale. (C) Charge distribution histogram from the same experiment. Integrals of 105 individual amperometric spikes acquired without stimulation were analyzed. (D) Peak amplitude histogram of the same recording. Filter frequency: 200 Hz.

