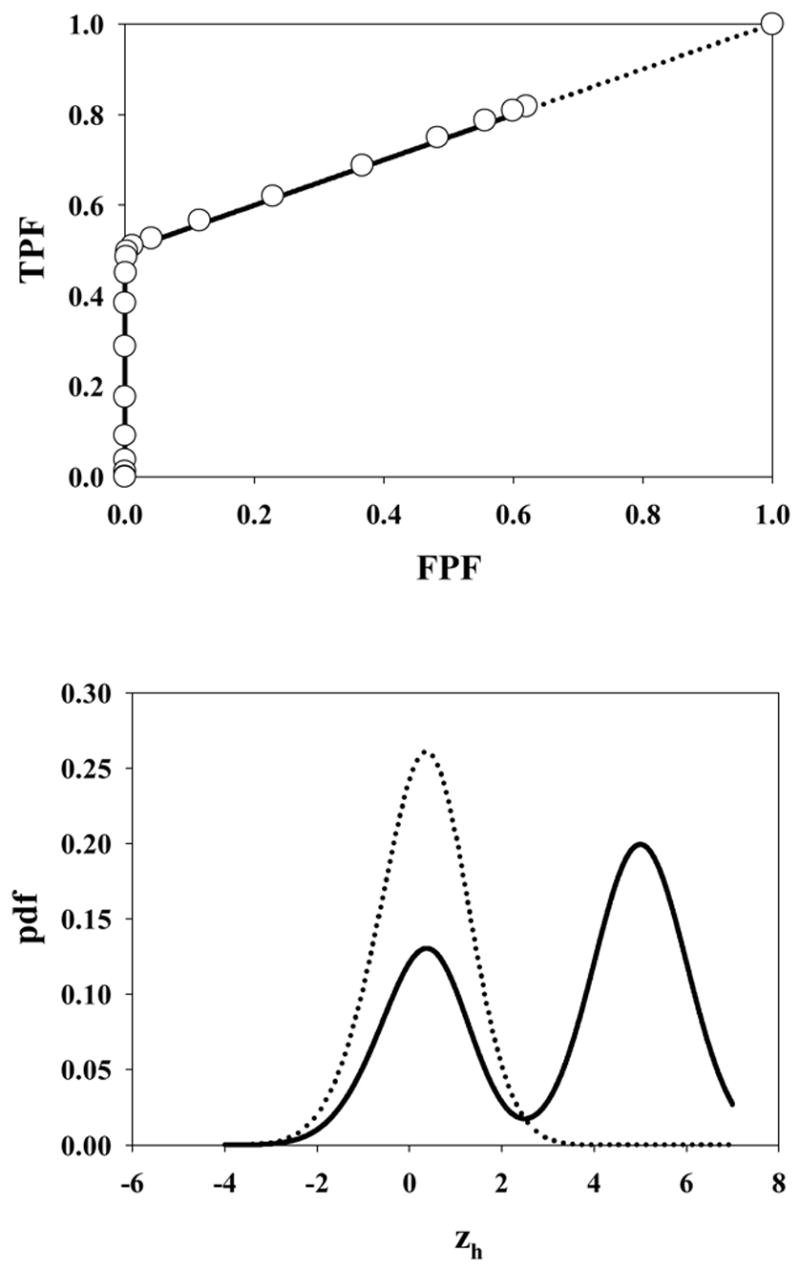
Fig. 4.

The ROC curve (upper panel) and pdfs (lower panel) for μ = 5, λ = 1, ν = 0.5 and s = 1. The open circles in the upper panel in this and succeeding plots are experimental ROC operating points from the simulations. The accessible portion of the ROC curve extends from (0, 0) to (0.63, 0.82). Note the strong bi-modality in the abnormal image pdf arising from the fact that half of the lesions are not hit. Therefore the highest decision variable for such images must have originated from a z-sample from N(0,1) yielding the peak near 0.
