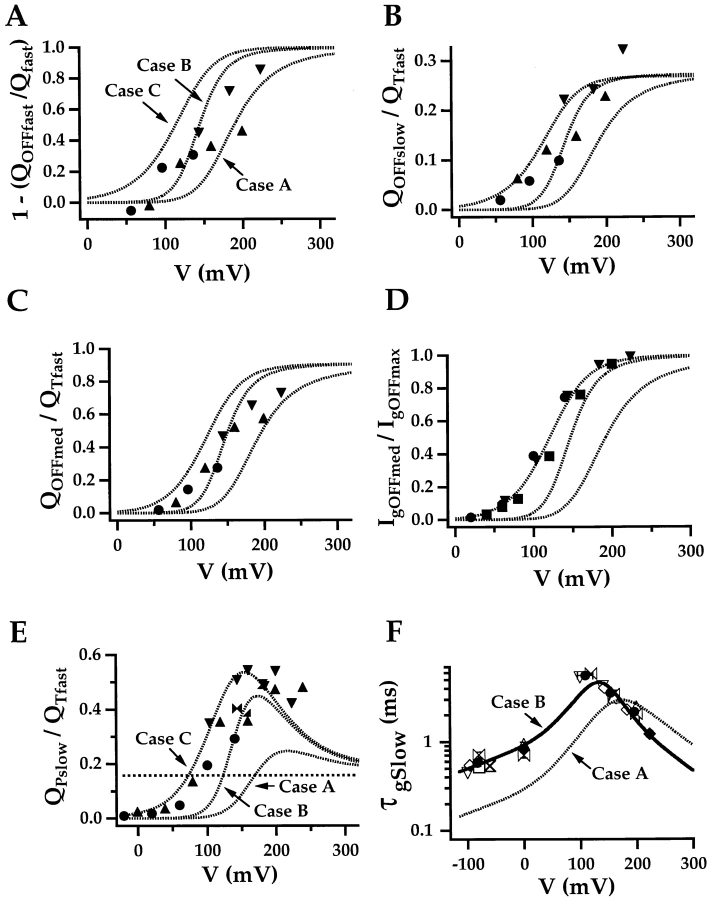
Figure 10.
Estimating open probability from charge movement. The allosteric model predicts a close relationship between P o and the various Q OFF components. A, B, and C plot the voltage dependence of these components measured after 20-ms pulses for three experiments. Solid lines indicate predictions of three models (Cases A, B, and C) described in the text. (A) The Fast OFF component should be proportional to the number of closed channels at the end of the pulse. Therefore, [1 − [Q OFFfast(VP)/Q fast(VP)] is plotted as an estimate of steady-state P o, where Q fast is the fast component of ON charge. (B) The Slow OFF component should be directly proportional to P o. The quantity (Q OFFslow(VP)/Q Tfast) is plotted where Q Tfast is the total fast charge estimated by fitting the Q fast–V relationship with a Boltzmann function. (C) The Medium OFF component is normalized by Q Tfast and plotted versus voltage. (D) The voltage dependence of the Medium OFF component was also examine by fitting I gOFF with a double-exponential function (τF, τM) and plotting the normalized amplitude of I gOFFmed against voltage. I gOFFmed was normalized by fitting the I gOFF–V relationship with a Boltzmann function corresponding to Case C (z = 0.98 e). (E) The Slow component of ON charge (Q pSlow) is expected to exhibit a complex voltage dependence (dashed curves) that is highly sensitive to P o. The data, normalized by Q Tfast, indicate that the slow component is too large to be accounted for by the initial allosteric model parameters (Case A) but a shift in the P o–V relationship (Cases B and C) produces a better fit. A dashed line indicates the charge assigned to the C–O transition (z L) (F) τgSlow determined from the time course of Q pSlow and Q OFFslow for many experiments are plotted versus voltage. Solid symbols represent mean ± SEM. Dashed and solid lines represent predictions of Case A and B, respectively (Table ).

