Figure 1.
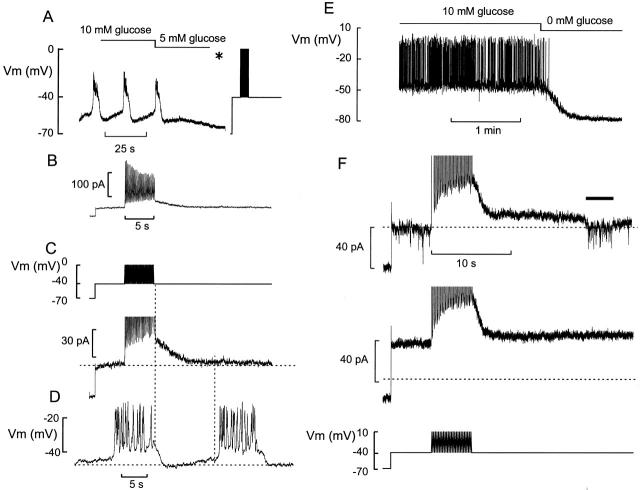
Train of action potentials elicits an outward current in β cells. (A) Membrane potential oscillations in a β cell exposed to 10 mM glucose. The glucose concentration was lowered to 5 mM as indicated above the voltage trace. *The amplifier was switched from the current-clamp into the voltage-clamp mode, the membrane potential held at −70 mV, and the command voltage varied as indicated. (B) The membrane currents elicited by the pulse train (C, top). Note time-dependent decline of outward current. (C, bottom) Change of holding current displayed on an expanded vertical scale. Note gradual development of a holding current. Same experiment as in B. (D) Membrane potential recording from the same cell as in C before lowering the glucose concentration. In C and D, the vertical line marks the temporal relationship between cessation of stimulation and the onset of rapid repolarization (left) and the onset of rapid depolarization during the subsequent burst (right). The horizontal lines indicate (from top to bottom) the steady state holding current at −40 mV, the plateau potential from which the cell repolarizes upon termination of the burst, and the most negative membrane potential attained between two bursts. (E) Membrane potential recording from an isolated (dispersed) β cell maintained in tissue culture. The glucose concentration was changed from 10 to 0 mM as indicated above the voltage trace. (F) Currents elicited by the train of depolarizations (bottom) in the presence of 10 (top) and 5 (middle) mM glucose. The inward current (indicated by the horizontal line above the current trace) is due to a burst of action potentials generated in a neighboring β cell. Note that step current elicited when stepping from −70 to −40 mV is larger at 5 than at 10 mM glucose, reflecting greater activity of the KATP channels.

