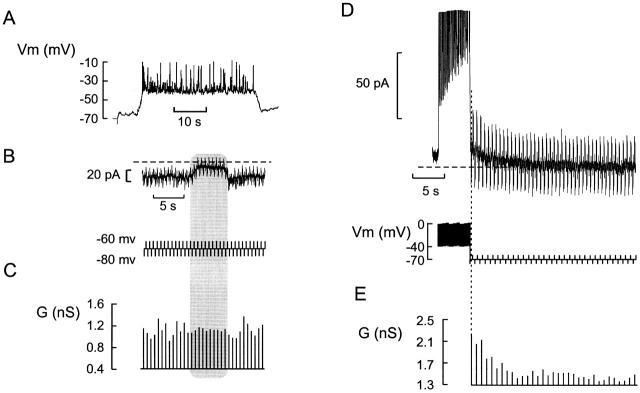
Figure 3.
Cell coupling does not account for Kslow current. (A) Membrane potential recording from a β cell in an intact islet. (B) Voltage-clamp recording at a holding potential of −70 mV. Changes of the cell conductance (G) were determined from the current responses (top) elicited by application of ±10-mV voltage pulses (200-ms duration, 2 Hz frequency; bottom). (C) Cell conductance calculated from the ±10-mV voltage steps in B. Note that the cell conductance is stable and amounts to ≈1 nS. In B and C, the shaded area indicated the silent interval between two successive bursts. (D) Current responses (top) elicited by a train of depolarizations followed by a series of ±10-mV voltage pulses applied from a holding potential of −70 mV to monitor the cell conductance (bottom). (E) Cell conductance (G) calculated from the ±10-mV voltage pulses. Note that the conductance is greatest (2.1 nS) immediately after the train, but subsequently declines to the steady state value (1.3 nS). The same cell was used in A–E.

