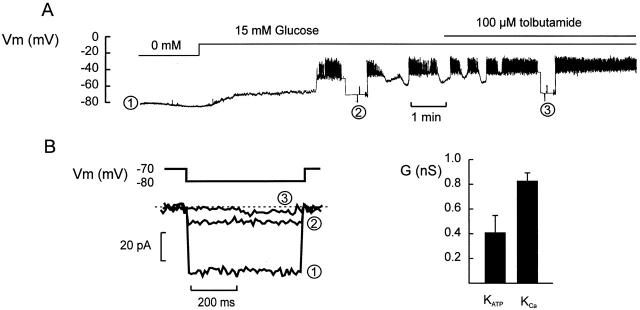
Figure 6.
Parallel recordings of glucose-induced changes of the membrane potential and membrane conductance in a β cell within an intact islet. (A) Membrane potential recorded in the absence of glucose, after elevation of glucose to 15 mM, and in the simultaneous presence of 15 mM glucose and 100 μM tolbutamide. At the times indicated (1–3), the amplifier was switched from the current-clamp into the voltage-clamp mode and the membrane conductance was monitored by application of ±10-mV voltage pulses (duration: 500 ms; frequency: 0.5 Hz). (B) Membrane currents measured during the voltage steps to −80 mV. The current responses shown in A–C were taken as indicated in A. (C) Net change of whole-cell KATP produced by 0.1 mM tolbutamide added in the presence of 10 or 15 mM glucose and the amplitude of the Kslow current elicited by a train of depolarizations.

