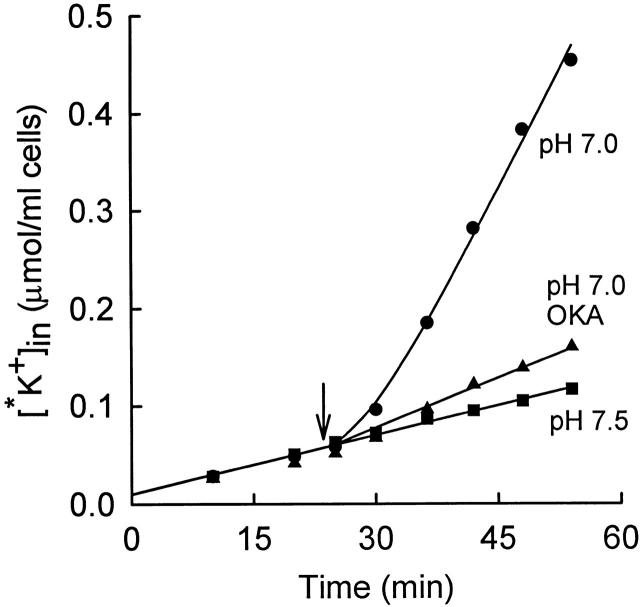
Figure 1.
Time course of 86Rb+ (*K+) influx into rabbit red cells at 37°C from a medium consisting of (mM): 155 NaCl, 5 KCl, 10 HEPES, 10−4 M ouabain. The three suspensions of cells were initially in a medium of pH 7.5. At the arrow, the pH of two of the suspensions (•, ▴) was lowered to 7.0 by adding 16 mM MOPS (and 4 mM NaHCO3 to facilitate pH equilibration). Okadaic acid (OKA) was added at t = 0 to one of the suspensions (▴), final concentration 100 nM. The curve through the pH 7.0 data (•) represents a single exponential increase in flux (), with a lag time of 6.5 min. Control suspension was at pH 7.5 throughout (▪).

