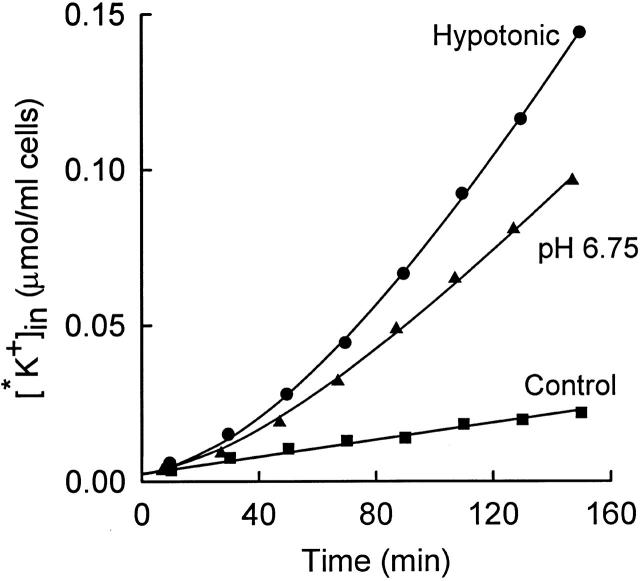
Figure 3.
Time course of influx of 86Rb+ (*K+) into rabbit red cells at 25°C. Influx was carried out in the following media (all containing 10−4 M ouabain; mM): 155 NaCl, 5 KCl, 10 HEPES, pH 7.5 (▪); 155 NaCl, 5 KCl, 10 HEPES, 18 MOPS, pH 6.75 (▴); or 103 NaCl, 5 KCl, 7 HEPES, pH 7.5 (•). The solid curves represent , with lag times of 61 (▴) and 84 (•) min.

