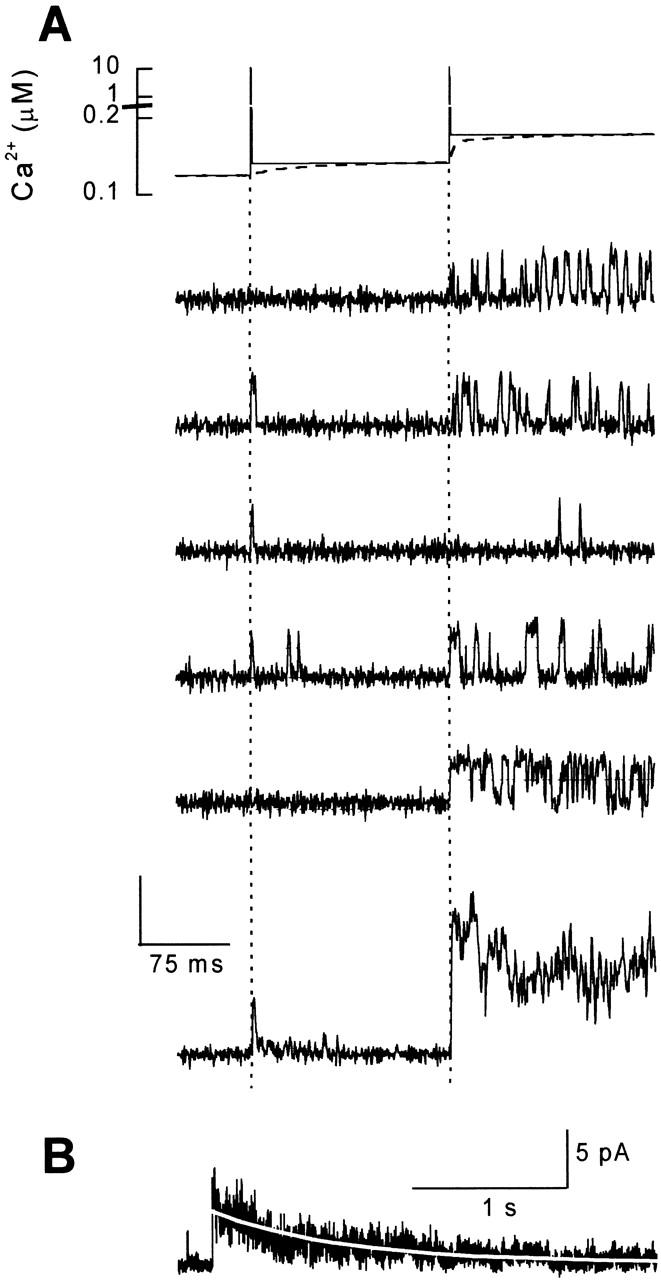
Figure 3.

Response of single RyR channels to a sequence of two identical laser flashes. (A, top) The time course of the Ca2+ stimuli estimated by the calcium cup electrode (dashed line) and calculated from the pre- and postflash steady state Ca2+ concentrations (full line). (Middle) Representative single-channel records measured at +40 mV. The flashes were applied at t = 60 and 230 ms (dotted lines). Only the first 400 ms of 3.2-s-long traces are shown. (Bottom) Ensemble current constructed from 54 episodes. The vertical calibration denotes 20 and 5 pA for the center and bottom, respectively. (B) The time course of the ensemble current at a compressed time scale. Open probability in response to the second laser flash decayed monoexponentially with a time constant of 880 ms (white line).
