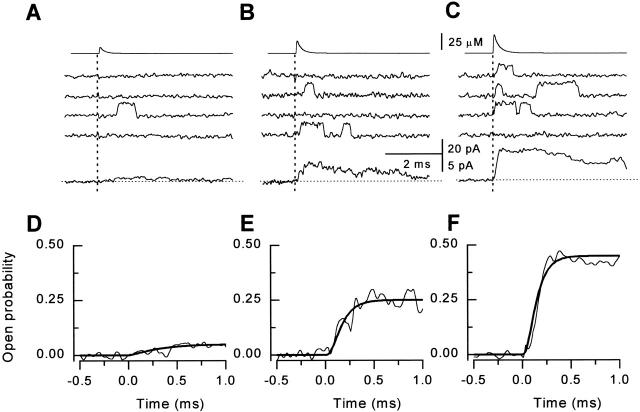
Figure 4.
Response of single RyR channels to spikes of different amplitude. In A–C, the flash energy setting was 45, 47.5, and 50, respectively, corresponding to peak Ca2+ concentrations of 9, 18, and 27 μM. (Top) Time course of the reconstructed calcium spikes applied to the bilayer. (Middle) Sets of representative single channel records measured at +40 mV. The flash was applied at t = 0 ms (dotted lines). (Bottom) Ensemble currents constructed from 32–96 individual episodes. (E–F) Exponential fits to the rising phase of the ensemble P o (expanded scale), corresponding to A–C, respectively. The time course of activation was best described by the equation:P o=P max1−e −tτa na,where τa = 0.27 ± 0.06, 0.09 ± 0.02, and 0.07 ± 0.01 ms, and n a = 3.5 ± 1.4, 2.5 ± 0.8, and 2.5 ± 0.3 for the ensemble averages in A–C, respectively.

