Figure 5.
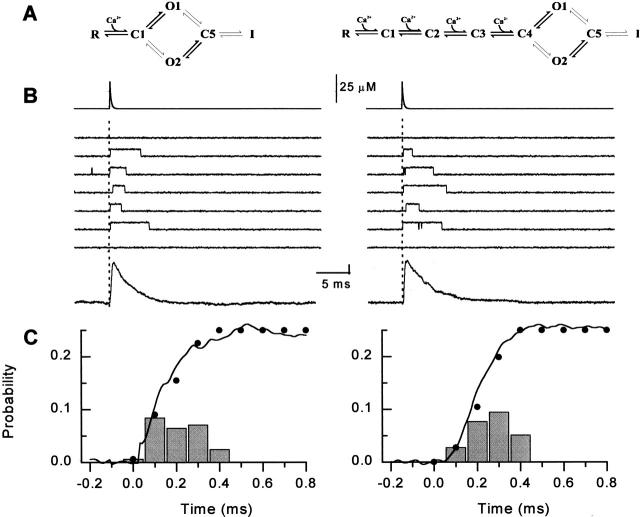
Description of the calcium dependence of the kinetics and amplitude of the ensemble open probability by different models of RyR gating. (A–E) Superposition of the experimental channel responses (thin noisy lines; data from the experiment shown in Fig. 4) and theoretical responses of the models (thick lines): Model 1Ca (A), Model 2Ca (B), Model 3Ca (C), Model 4Ca (D), and Model 5Ca (E). (F) The relationship between the peak open probability and the Ca2+ spike amplitude. The symbols with their standard deviations represent measured peak open probability at different levels of peak calcium during the spike. The lines represent the theoretical dose–response curves () for models with one to five Ca2+ binding sites. Labels correspond to the number of Ca2+ binding steps in the model.

