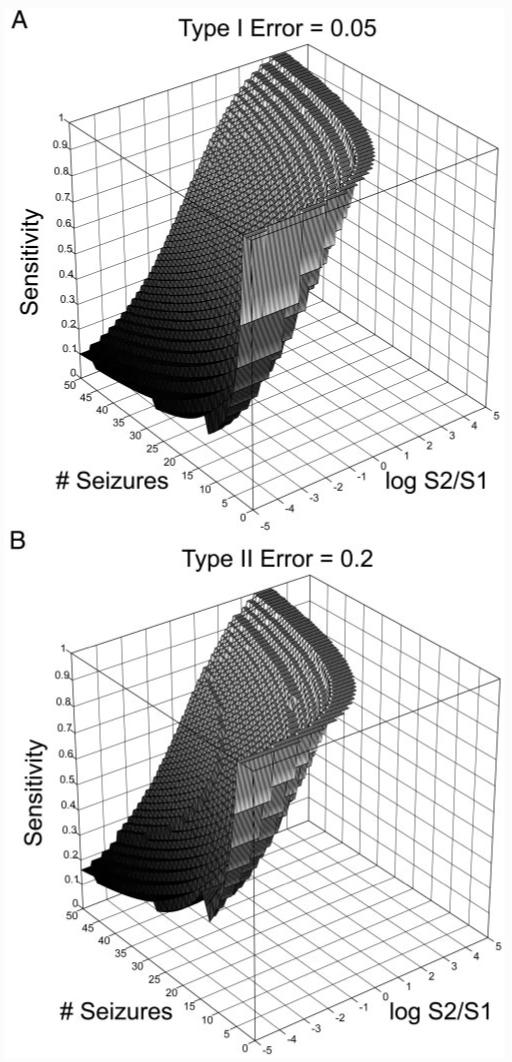
FIG.2.

A: minimum sensitivity required for statistical validation (z-axis) vs. the number of seizures in the data set (y-axis) vs. log base 2 of detected state/baseline state proportions (x-axis), for type I error = 0.05. For any given number of seizures and detected to baseline state proportion, a minimum sensitivity required for statistical validation at the 0.05 error level lies above the surface. Statistical validation is difficult in regions where the detected state constitutes a large proportion of the EEG, and in regions where the number of seizures is too low. (Note that the nonsmooth boundary results from the binomial equation, a discrete function.) B: minimum sensitivity required for statistical validation (z-axis) vs. the number of seizures in the data set (y-axis) vs. log base 2 of detected state/baseline state proportions (x-axis), for type II error = 0.2, assuming the minimal sensitivity calculated in A for a type I error of 0.5.
