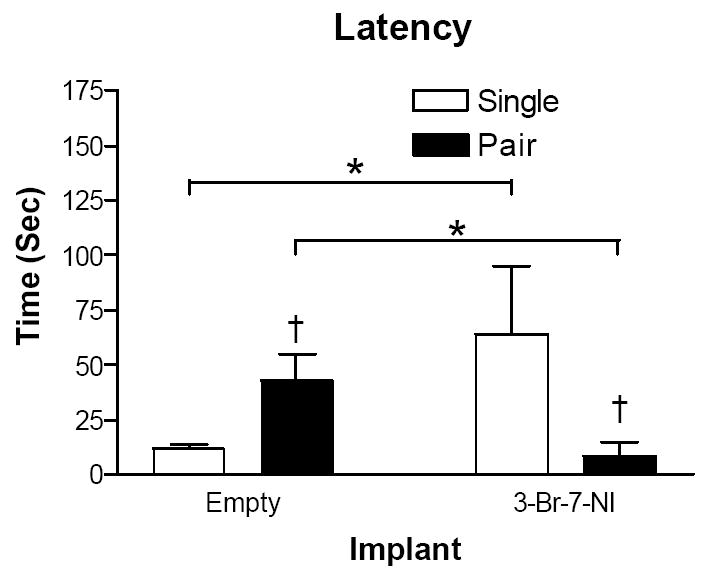
Figure 4.

Mean ± SEM of latency (sec) to enter an open arm in the elevated plus-maze. Open bars represent single housed mice. Black bars represent pair housed mice. * (Comparison within housing environment) = p < 0.05; † (Comparison within implant type) = p < 0.05.
